
Score your forecasts, compare years and watch the assistant work
How close was last quarter's forecast to what really happened? How does this October compare with the last two? NineAnts 0.2, our newest release, answers both at a glance. Every forecast gets an accuracy score, reports put years side by side, and the assistant shows its work while it thinks. Working with large tables now feels like working in a spreadsheet.
Score your forecasts
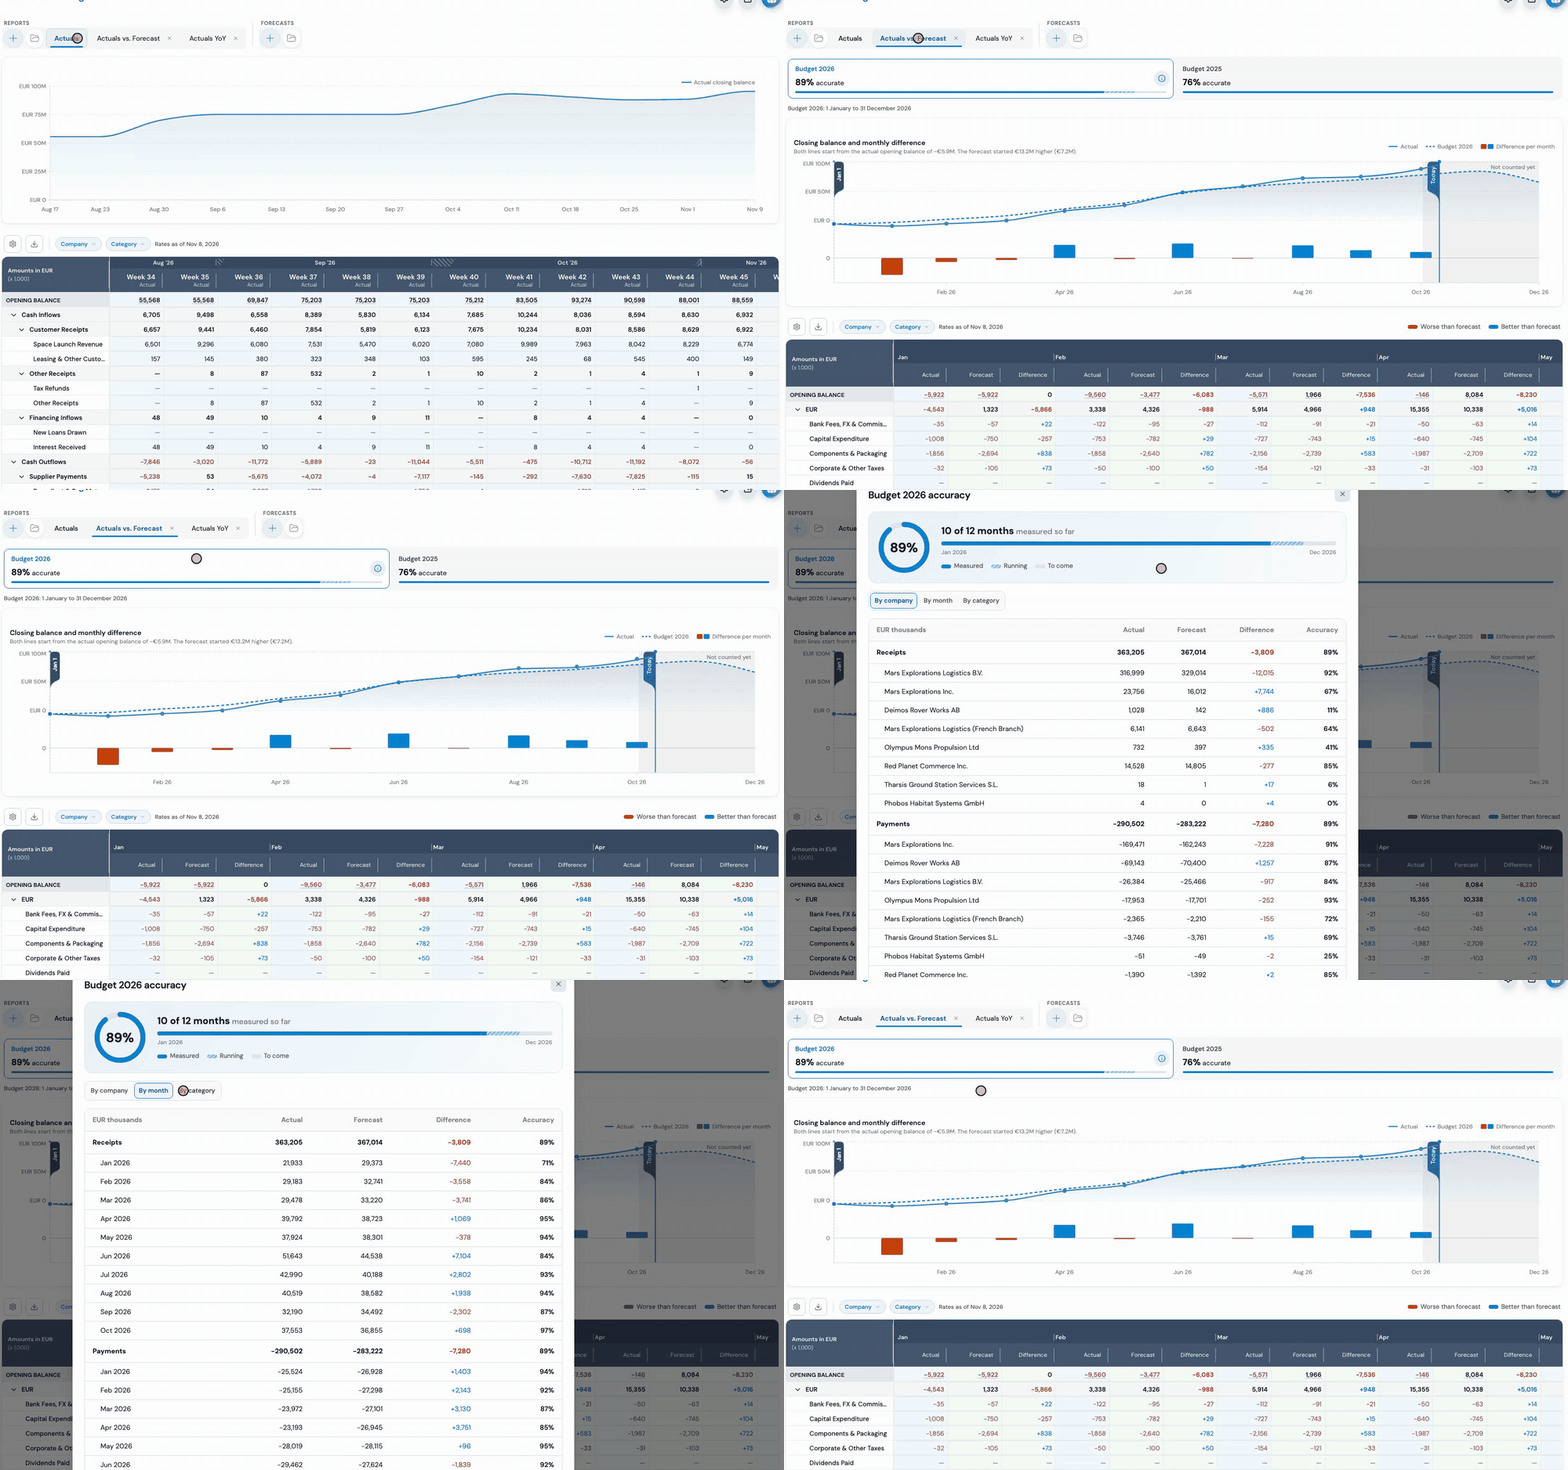
Finally, one number for how good a forecast is. Turn on accuracy analysis in a report and every forecast gets a score from 0% to 100%, where 100% means it matched what really happened. Click the info icon to see exactly how the score is built: by company, by period and by category. Hover the chart to see the difference per month.
Year on year
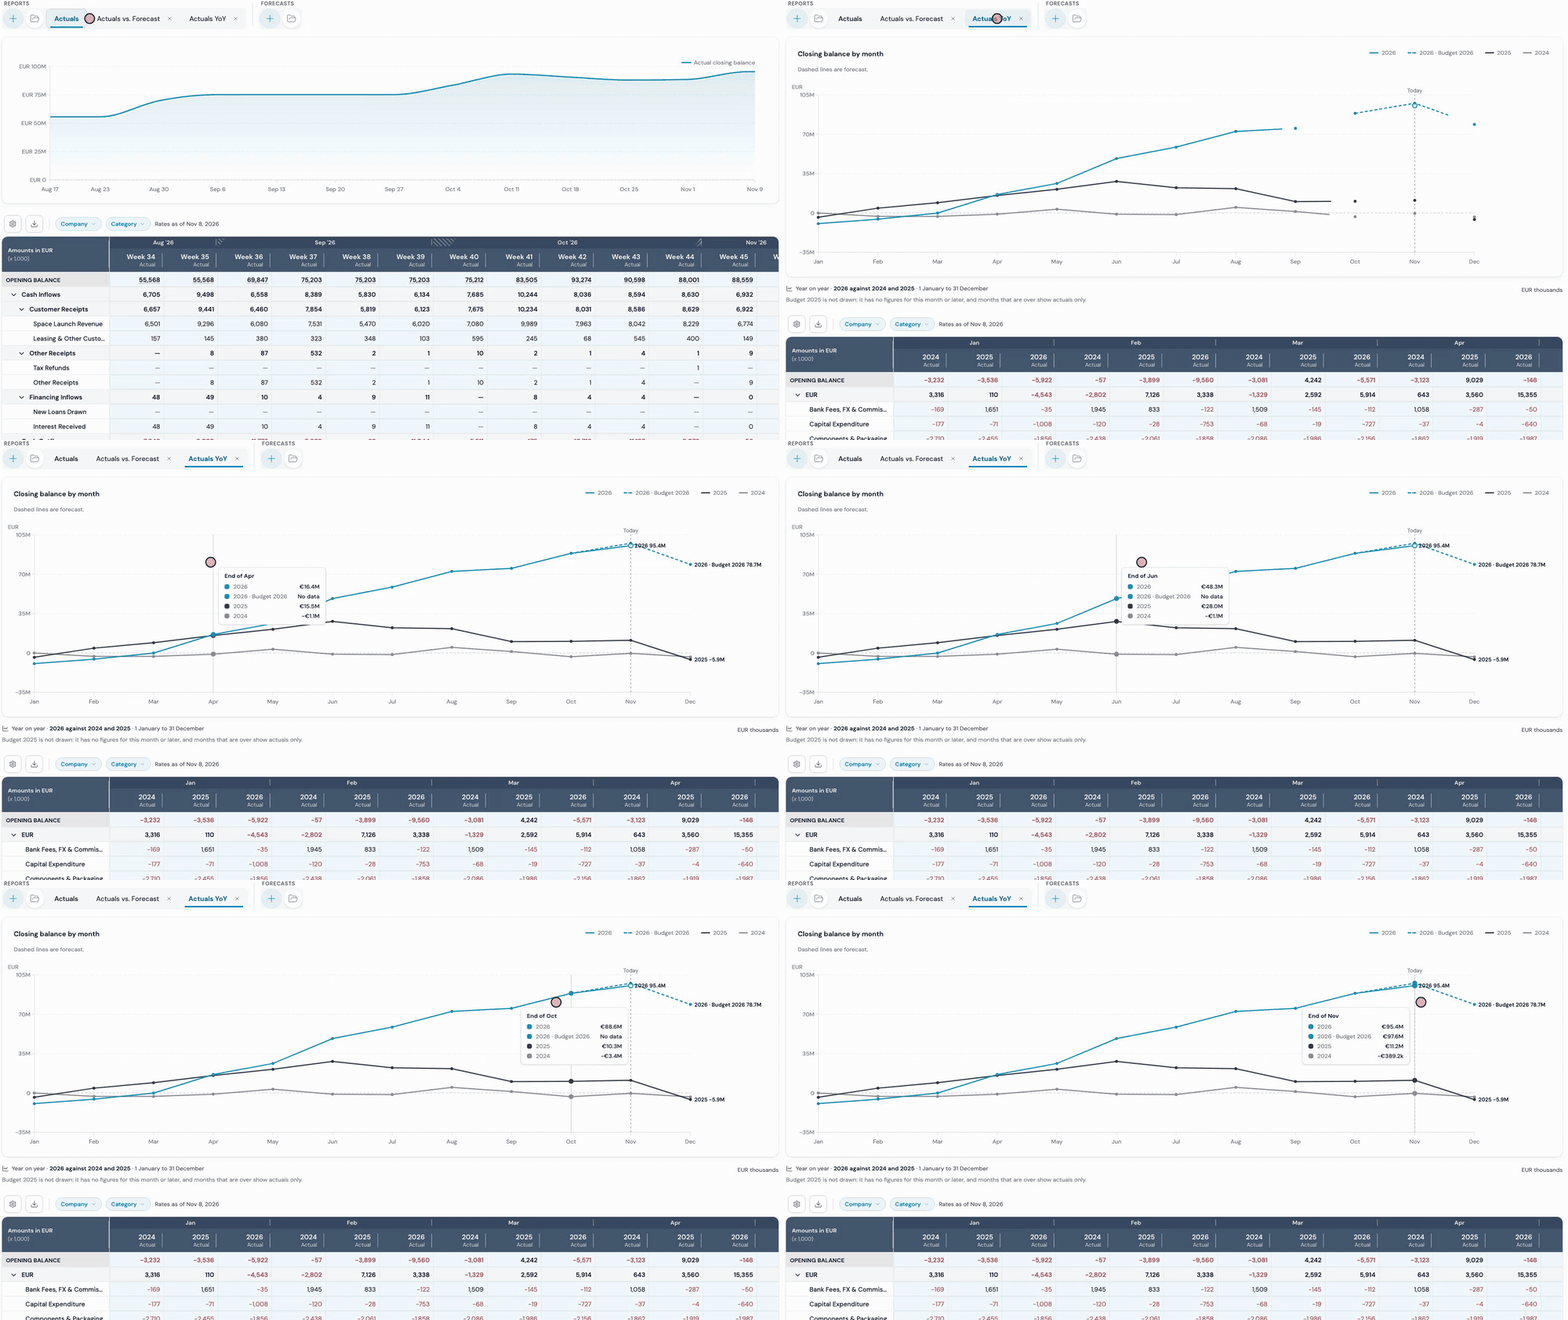
See this year against the last two in one glance. Reports and the Actuals page can show each year side by side, in the chart and in the table, by month, quarter, week or day. Weeks line up by week number and days by calendar date, and the Excel export keeps the same layout.
Watch the assistant think
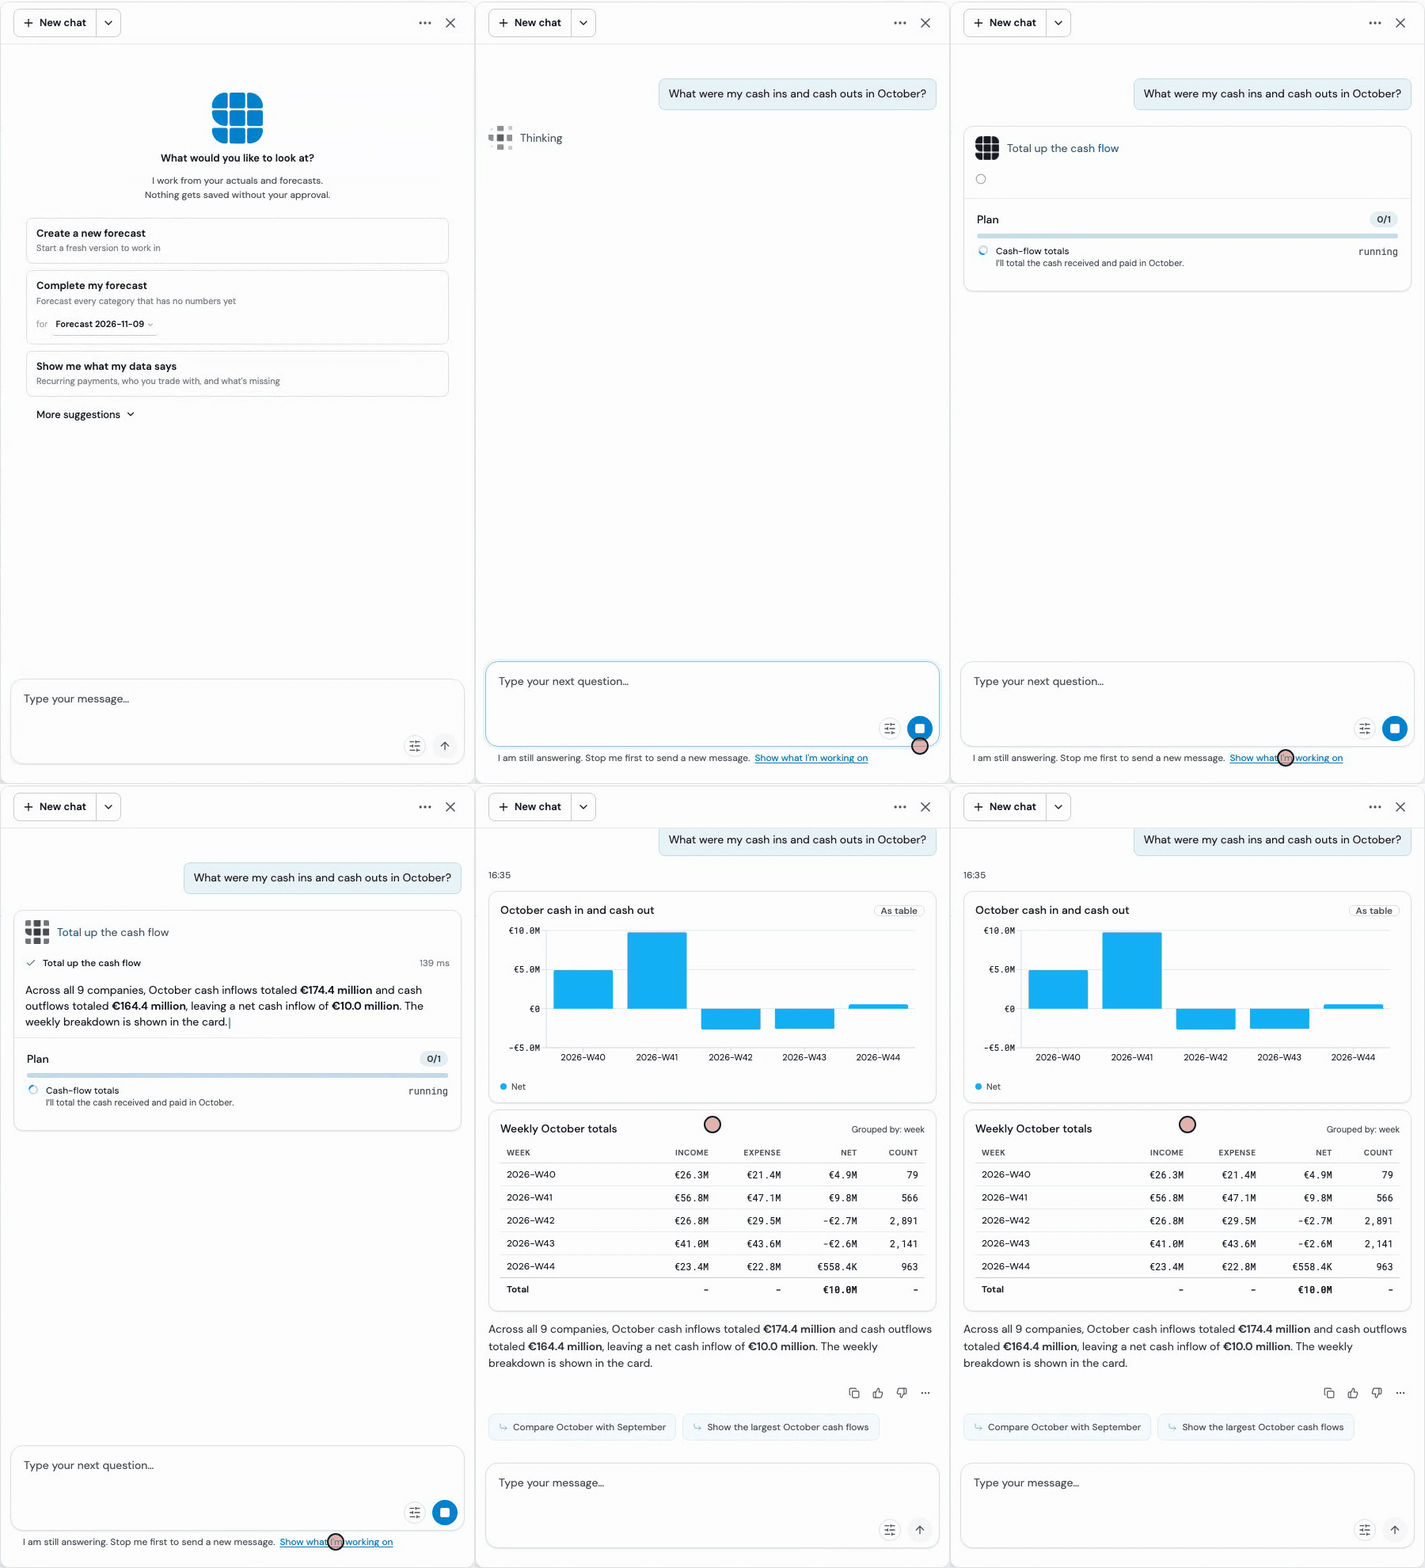
Ask a question and watch the assistant work. You see its plan, each step and its answer as they happen. Stop works at any moment, and a stopped or failed answer can be retried with one click. After a reload, the chat reopens your last conversation, and a card shows work that finished while you were away.
It remembers its methods. Each forecast line remembers how it was made. If nothing changed, the next run reuses that method, and when it decides again it tells you why.
Fast or Thorough. Fast mode, on by default, reuses methods and lets a quick AI check look them over. Switch to Thorough for a full review of every line.
You stay in charge. The Treasury Agent names the companies each answer covers and only removes forecast entries after you approve. A forecast proposal offers Skip, Change forecast or Accept, with a trust rating of High, Medium or Low.
Every forecast and report has its own dates
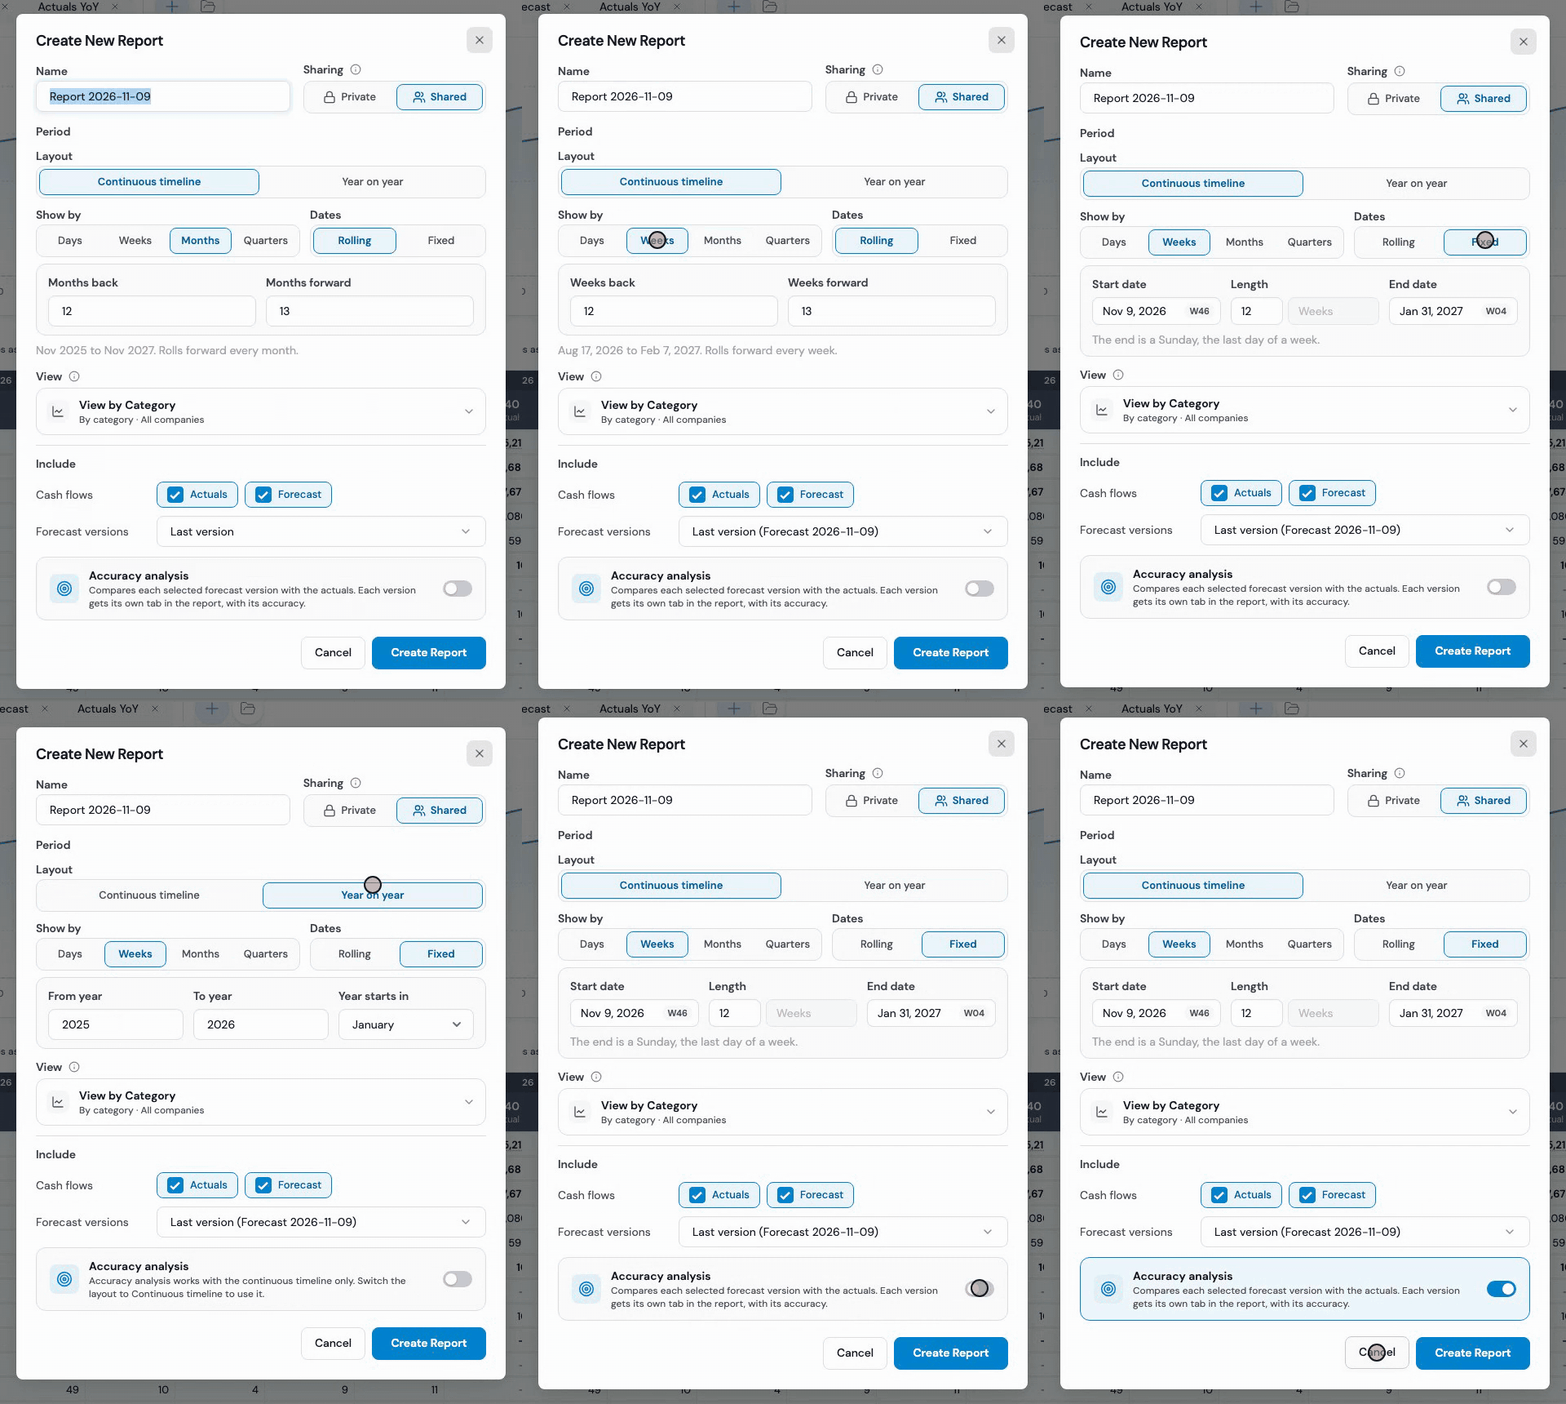
A forecast now has a start date and a length in days, weeks, months or quarters. Change the length and the end moves with it. A new forecast starts today, with the length you used last. Reports choose between a continuous timeline and year on year, with rolling or fixed dates, and the Open lists show each item's dates at a glance.
Close bank accounts, and find accounts you haven't set up
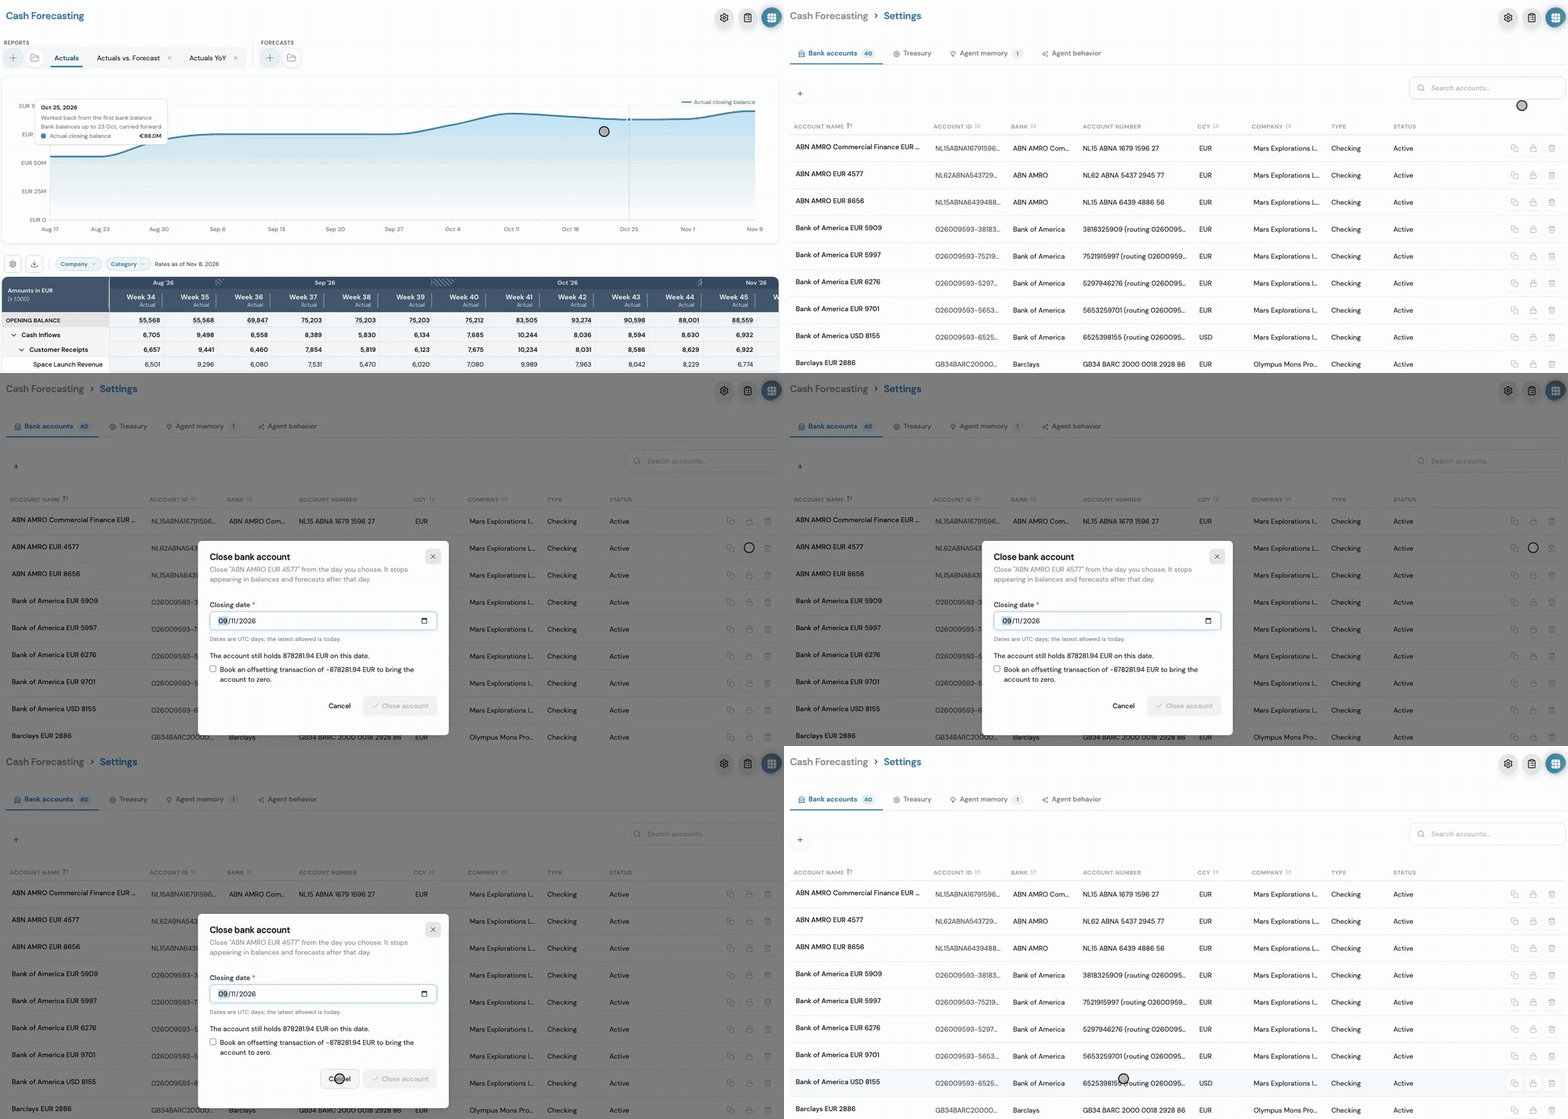
Close a bank account at a date: its history stays, and nothing after that date counts. Money on an account ID that isn't set up yet now shows as an unregistered account, with a note and a link to register it, its details filled in from the data.
Pick, copy and paste like in a spreadsheet
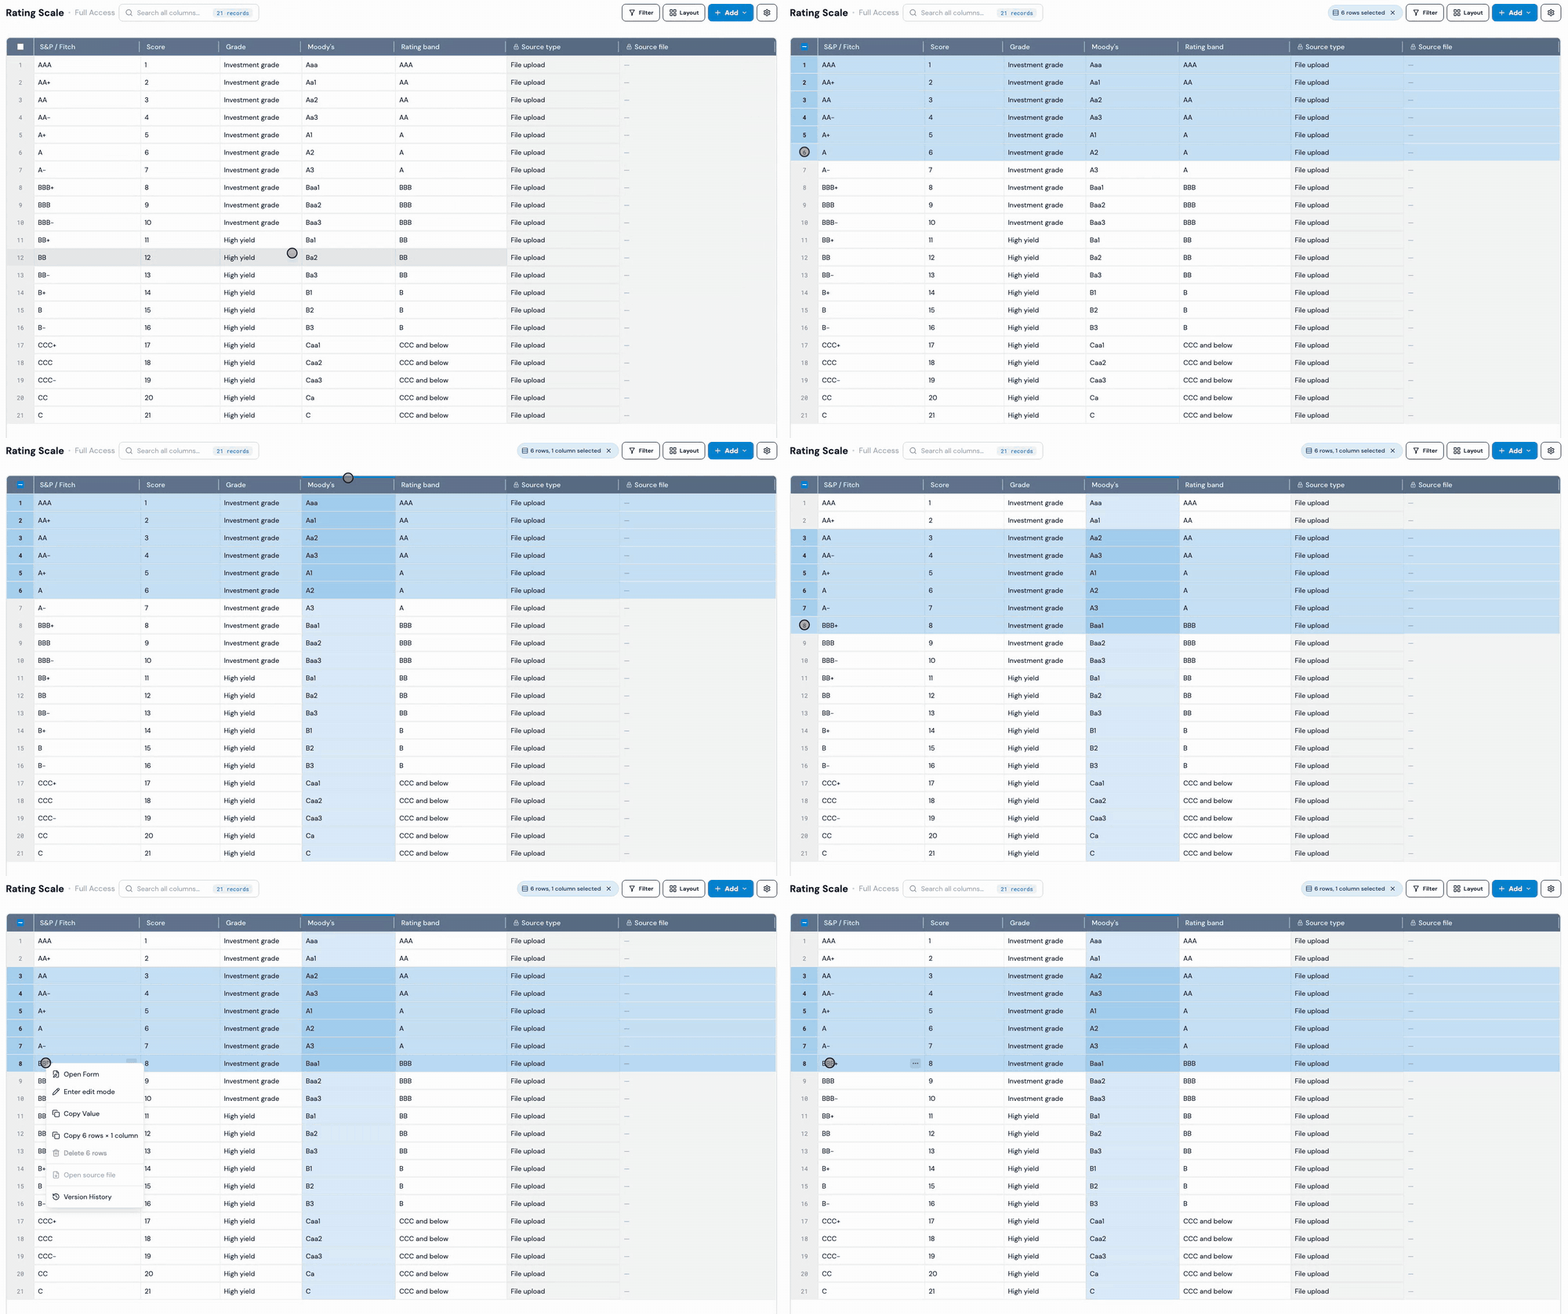
In Tables you pick rows by their row numbers: drag down, Shift-click or Cmd/Ctrl-click. The strip at the top of a column header picks the whole column. Press Cmd/Ctrl+C and paste straight into Excel, with numbers as numbers and dates as dates. Cmd/Ctrl+S saves, and the app asks before you leave unsaved changes.
Work with up to a million rows at once
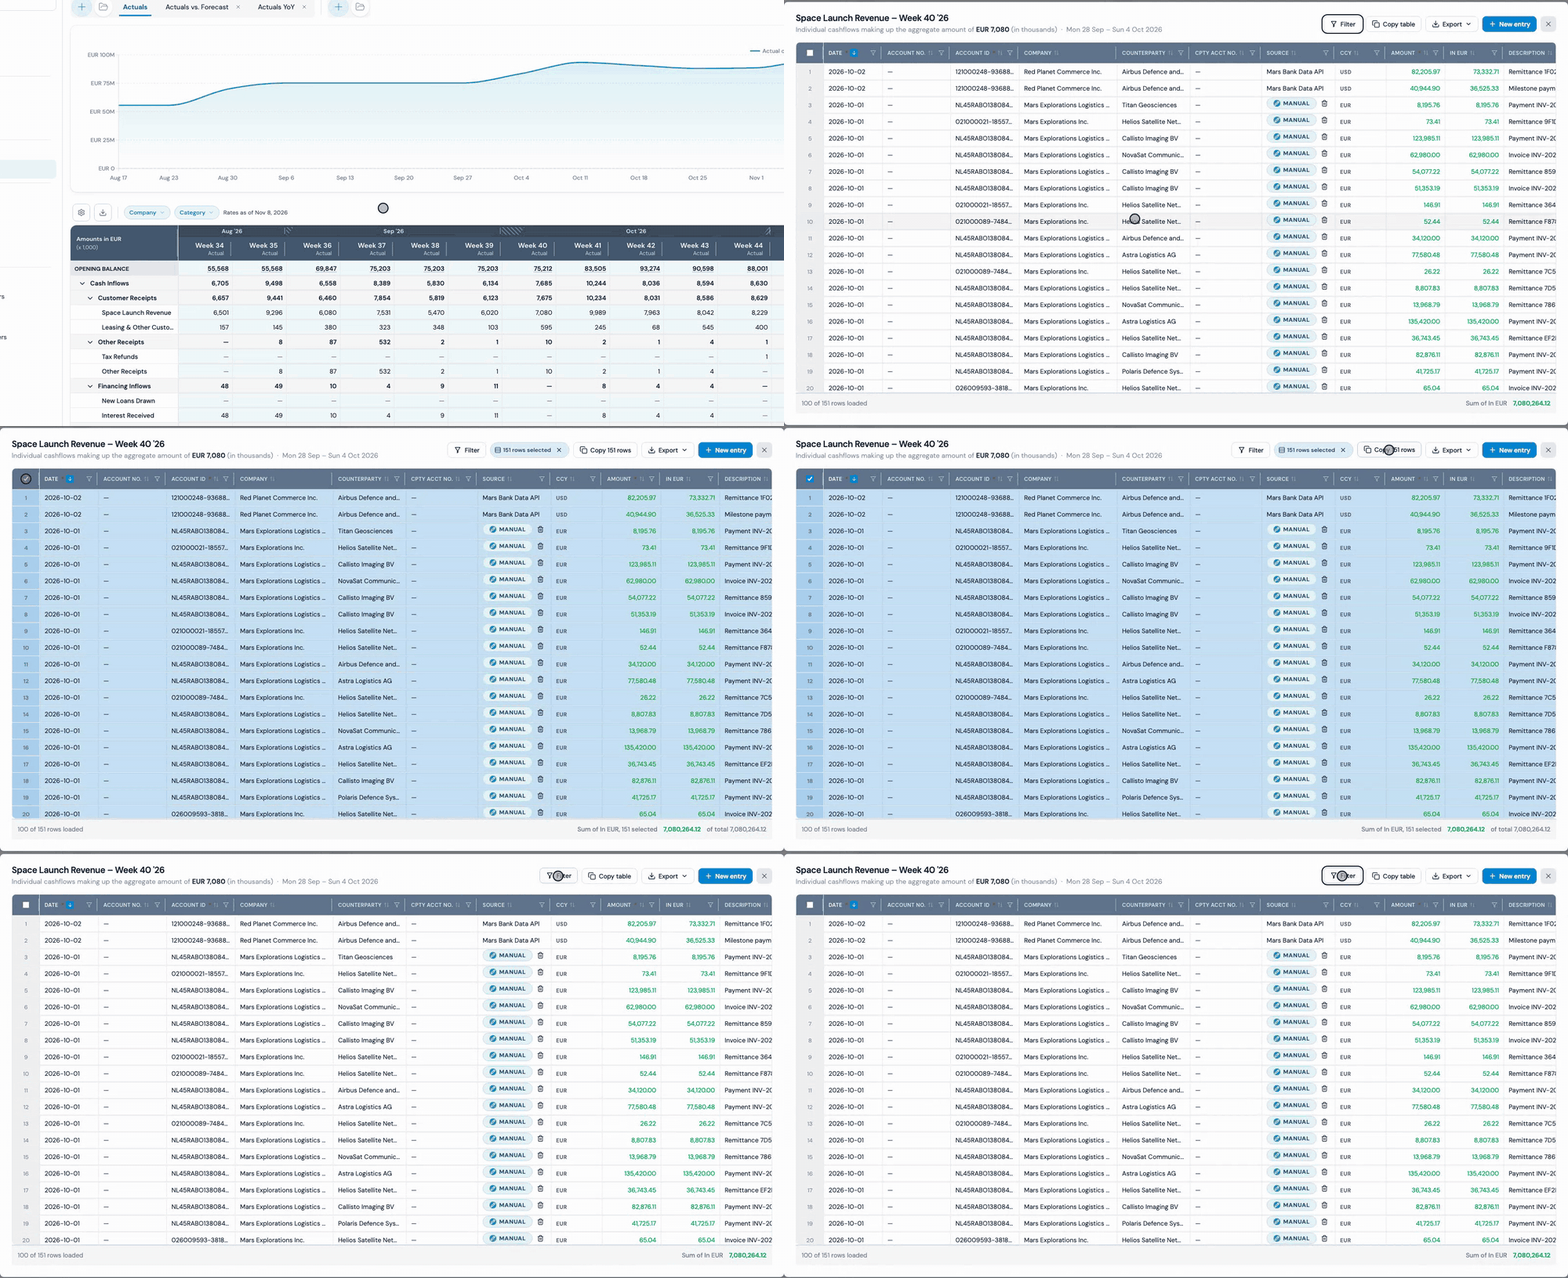
Click any number in your forecast to see the cashflows behind it. Select all, Copy and Delete now work on up to 1,000,000 rows, in Tables and in these breakdowns. The buttons say exactly what they will do, such as "Copy 151 rows", and every bulk delete gives you 10 seconds to undo it.
A simpler forecast import
Importing a forecast file now takes four clear steps: upload and check the sheet, map the columns, match accounts and categories, and check the data. CSV works, matches can come from your saved mapping or from AI, and re-importing a file asks whether to add, skip or replace rows. Large files work too.
Smarter categorization
Test a rule against your table from the rule editor, see which rule set each category with "Why this category?", and check a value against a column of another table instead of typing hundreds of values by hand. Before a run, you see how many records each option covers.
Invite people by email
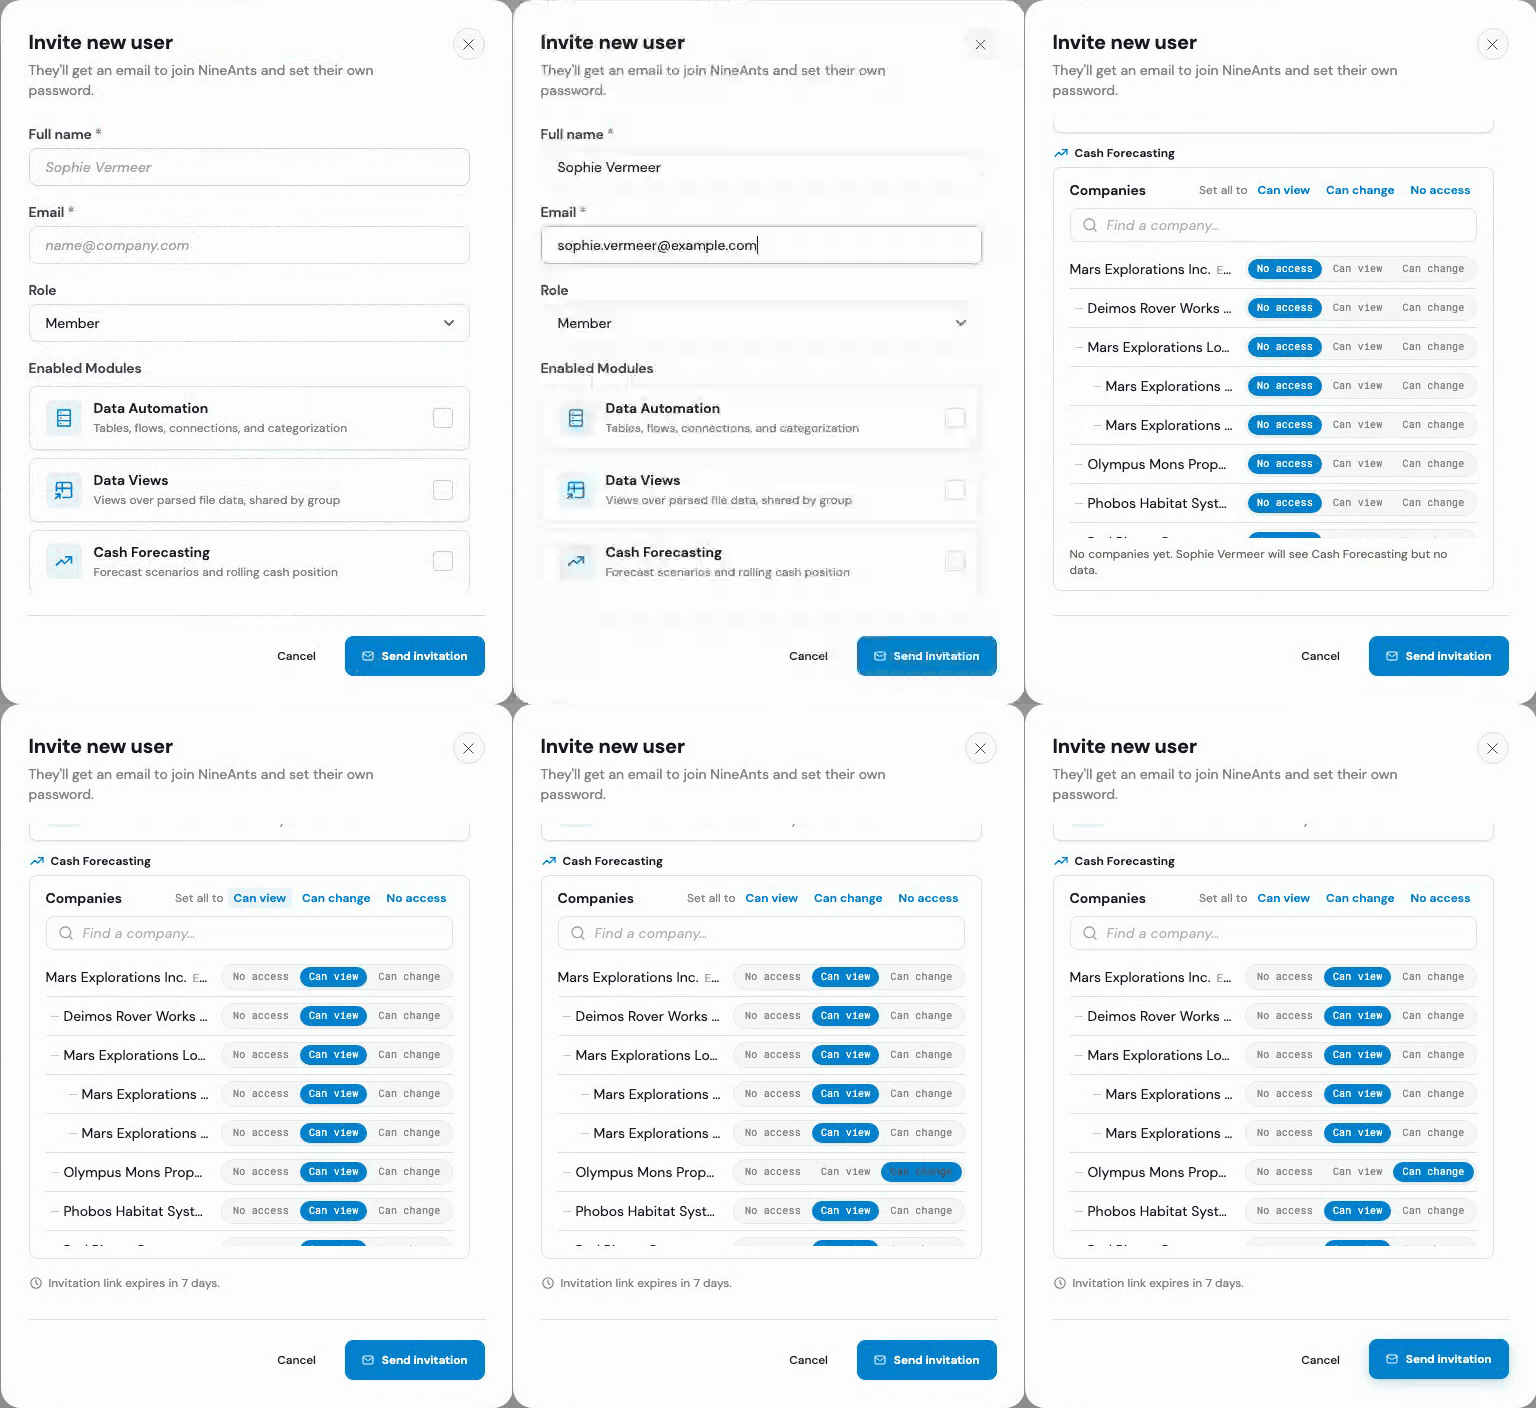
Managers invite people from Companies & users. They get an email, choose their own password and go straight to two-step setup. You decide per company whether someone has no access, can view or can change, and invitations last 7 days.
Much faster
Saving 1,000 rows in a table of 50,000 now takes about 0.2 seconds, where it used to take 22 to 33. Saving many forecast edits at once is faster too: 31 rows in about 0.4 seconds, where 7 rows used to take 6.
Also new
Plain words. About 120 labels and messages are rewritten, and every forecasting method has an info icon that explains what it does.
Rows with no category. A button such as "12 rows with no category" takes you straight to them, and you can categorise them in one step.
A calmer timeline. One scrollbar, with the header and first columns in view as you scroll.
Always up to date. When we release a new version, open tabs offer a Reload button.
A shared folder. Every client gets one folder for exchanging files, open to all its users.
Stronger security. We tightened how sign-in and accounts are protected.
Improvements and fixes (6)
- A bank account that holds data can't be deleted or change currency. Close it instead.
- Account IDs that differ only in capital letters or spaces count as one account.
- Text matches without regard to capital letters or spaces at the start and end.
- Currency columns accept only supported currency codes, so "eur" is saved as "EUR".
- When your filters hide everything, the page says so and offers to clear them.
- Run now works on a paused flow, and keeps its schedule paused.