
Forecast together with the Treasury Agent, build dashboards in plain words, fix gaps in your bank data and create your own API keys
Forecast together with the Treasury Agent. It works through every cash flow category and shows how it got to each number. You approve, change or skip its forecast with a click or a drag of a bar, or you let it run on its own.
Build dashboards by asking. Type "Show our cash bridge for the last 12 months" and a moment later the chart is on your screen, made from your own data.
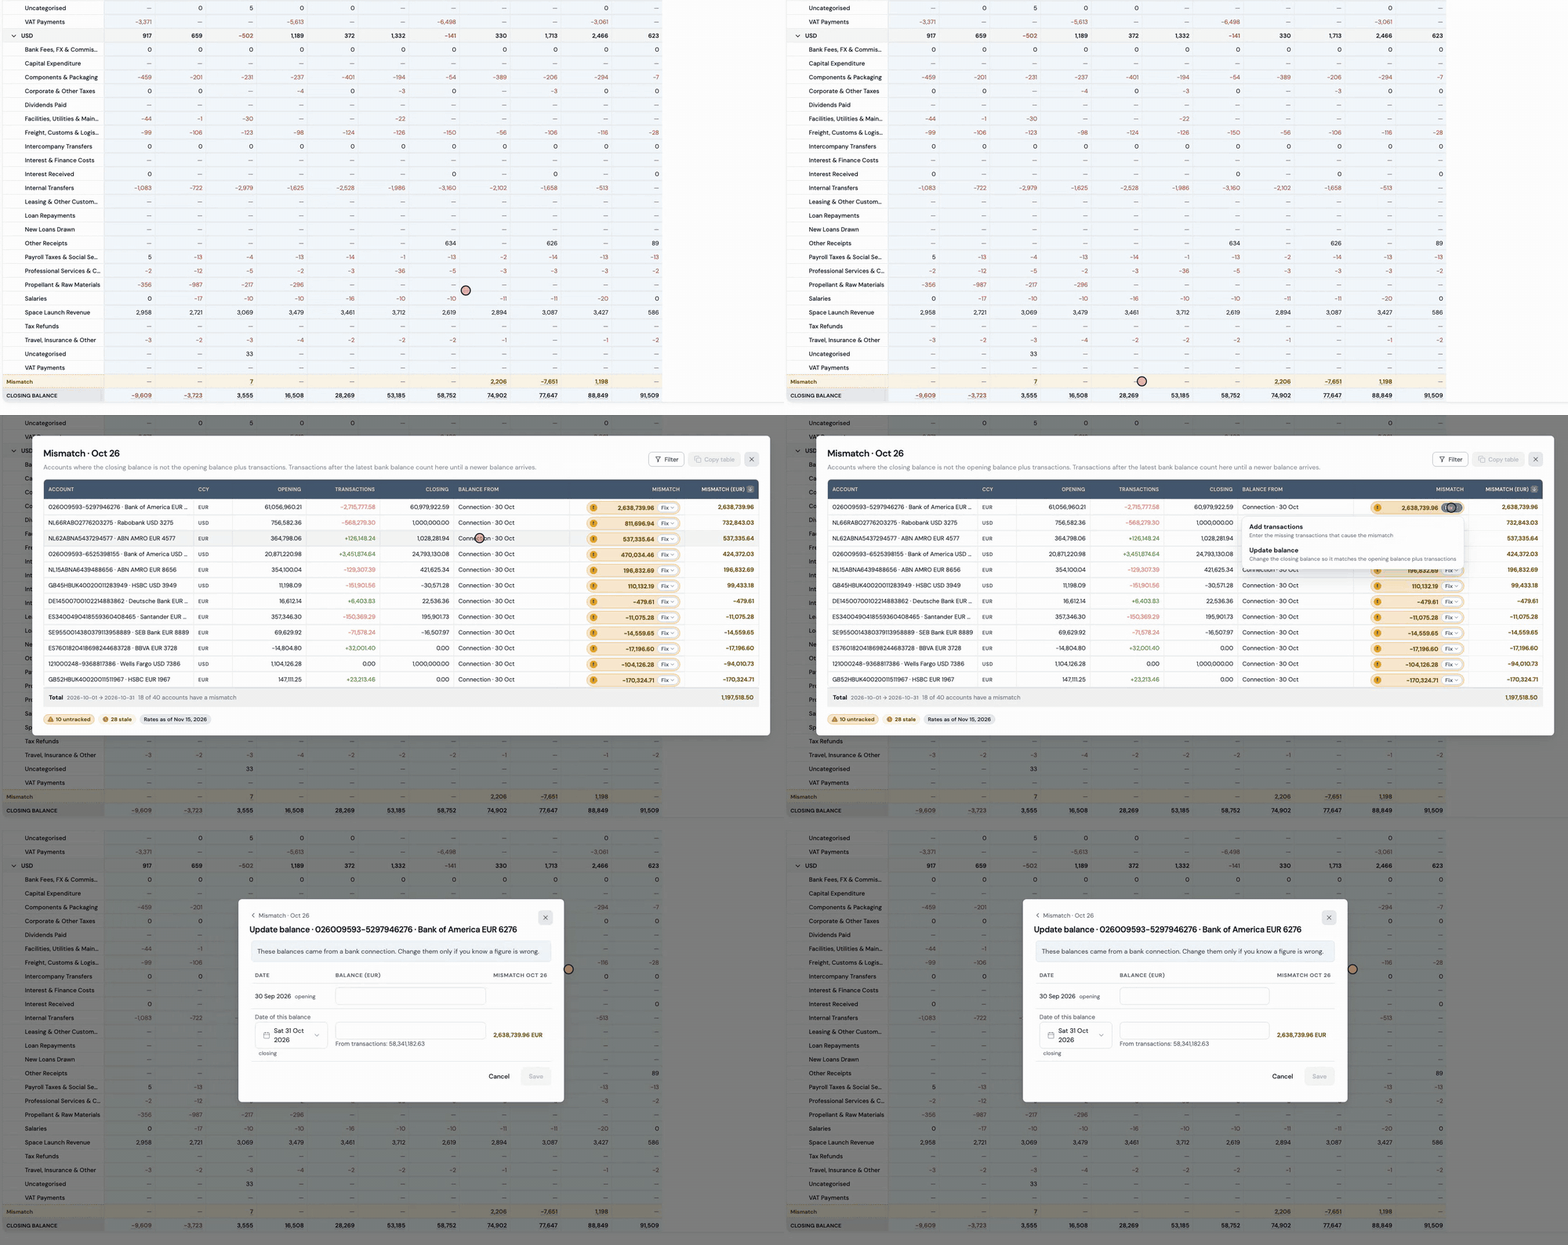
Bank data you can trust. When the transactions on a statement do not explain the change in balance, you see the gap and fix it on the spot.
Your own API keys. Your data goes wherever you work, from Excel and Power BI to your own systems.
The agent forecasts, you stay in control
The Treasury Agent forecasts your cash flow categories one by one, and you choose how much it does on its own. Let it wait for your decision on each category, or turn on auto-save and it saves every forecast itself. When it waits, you see its numbers next to last year and two years ago, with a sentence on how well the method did on past months. Do you agree? Click Save forecast. Do you expect something different? Drag the bars to your own amounts first, and the forecast is saved with your changes. You can also skip a category, with or without a reason.
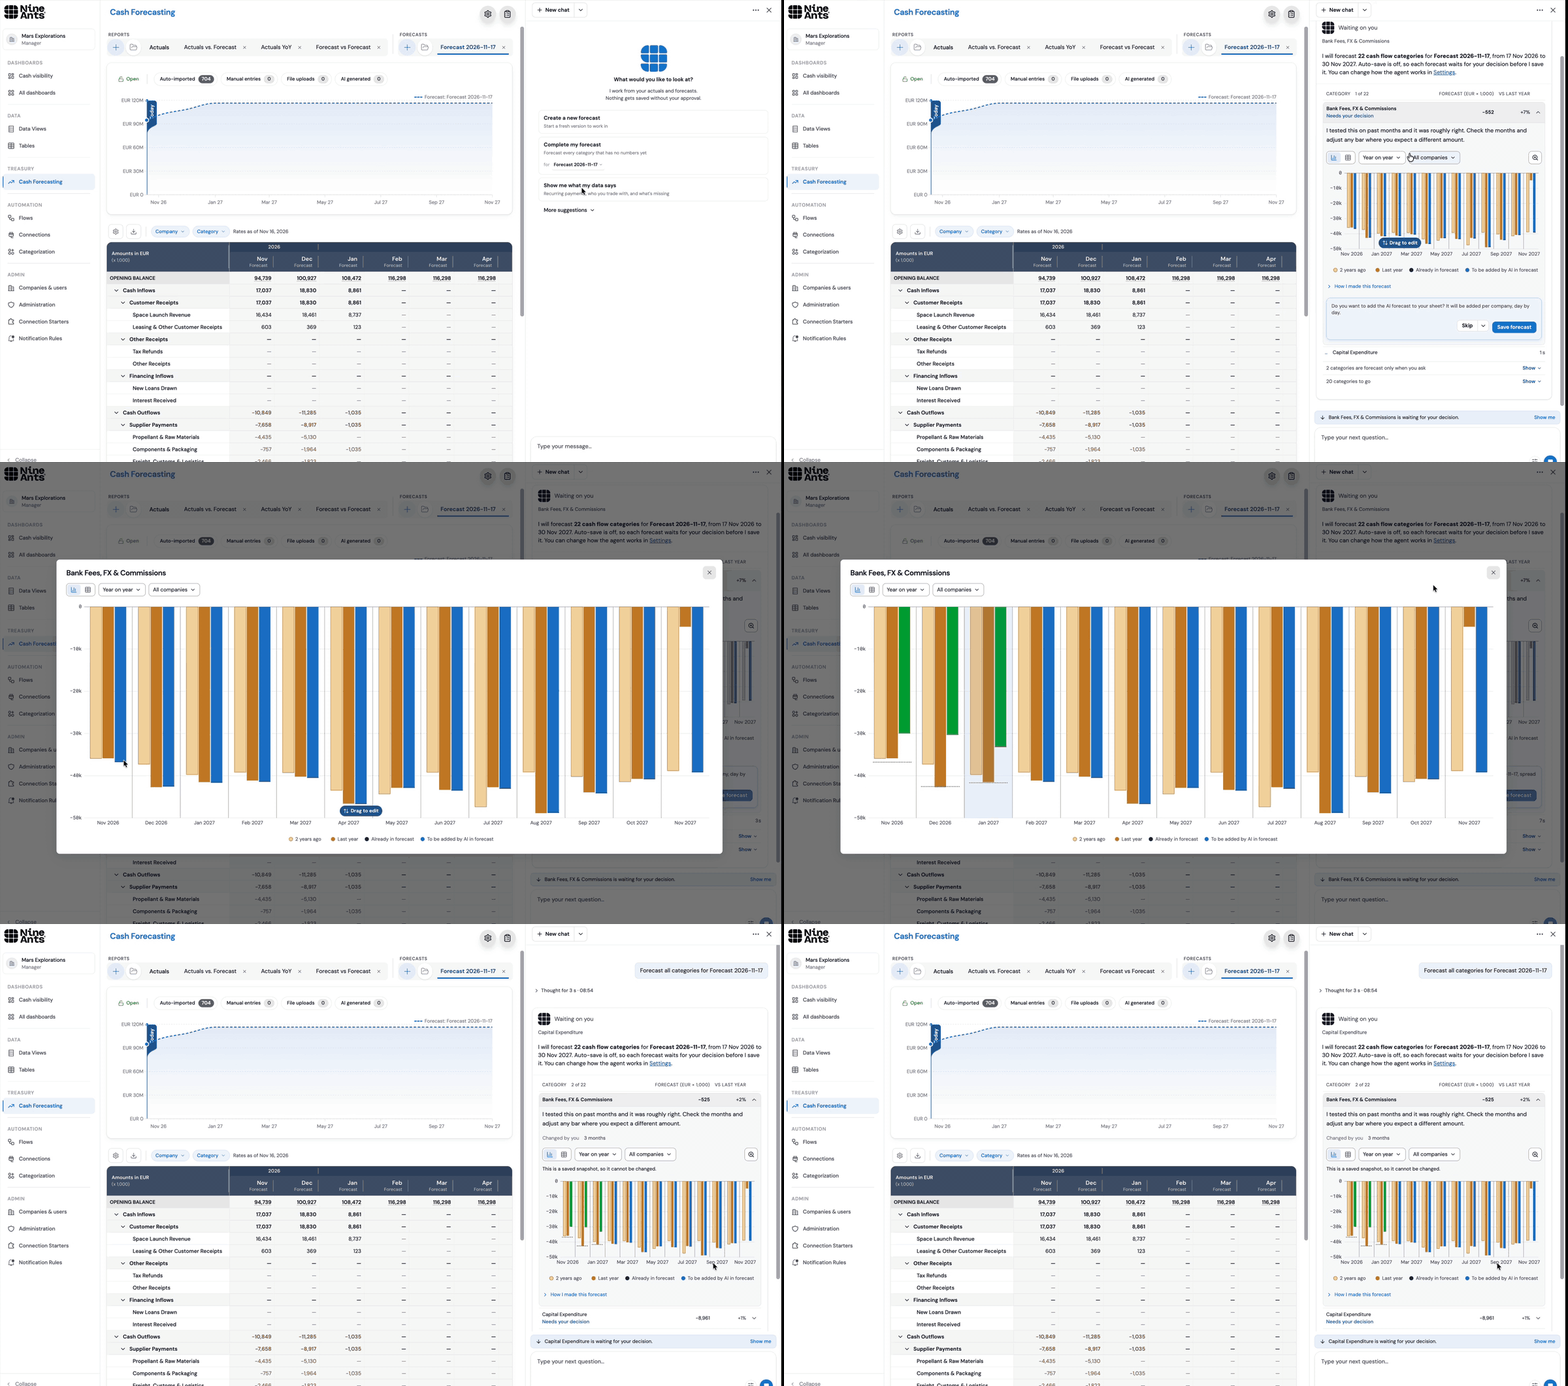
Your changes stay yours. A month you changed is marked Changed by you, with the AI's number and a Restore link next to it.
Tell it what you know. Ask, for example, "forecast bank fees, set it to 10k a month". The agent uses your amount, shares it out over your companies and marks it Stated by you.
Every forecast is explained and can be audited
You can see how each number was made, and so can your auditor. A finished run gives you one row per category with the forecast and the change from last year, then money in, money out and a list of things to check. Open a category for its chart and a summary in plain words. "How I made this forecast" shows every step the agent took, and ends with what was saved for each company.
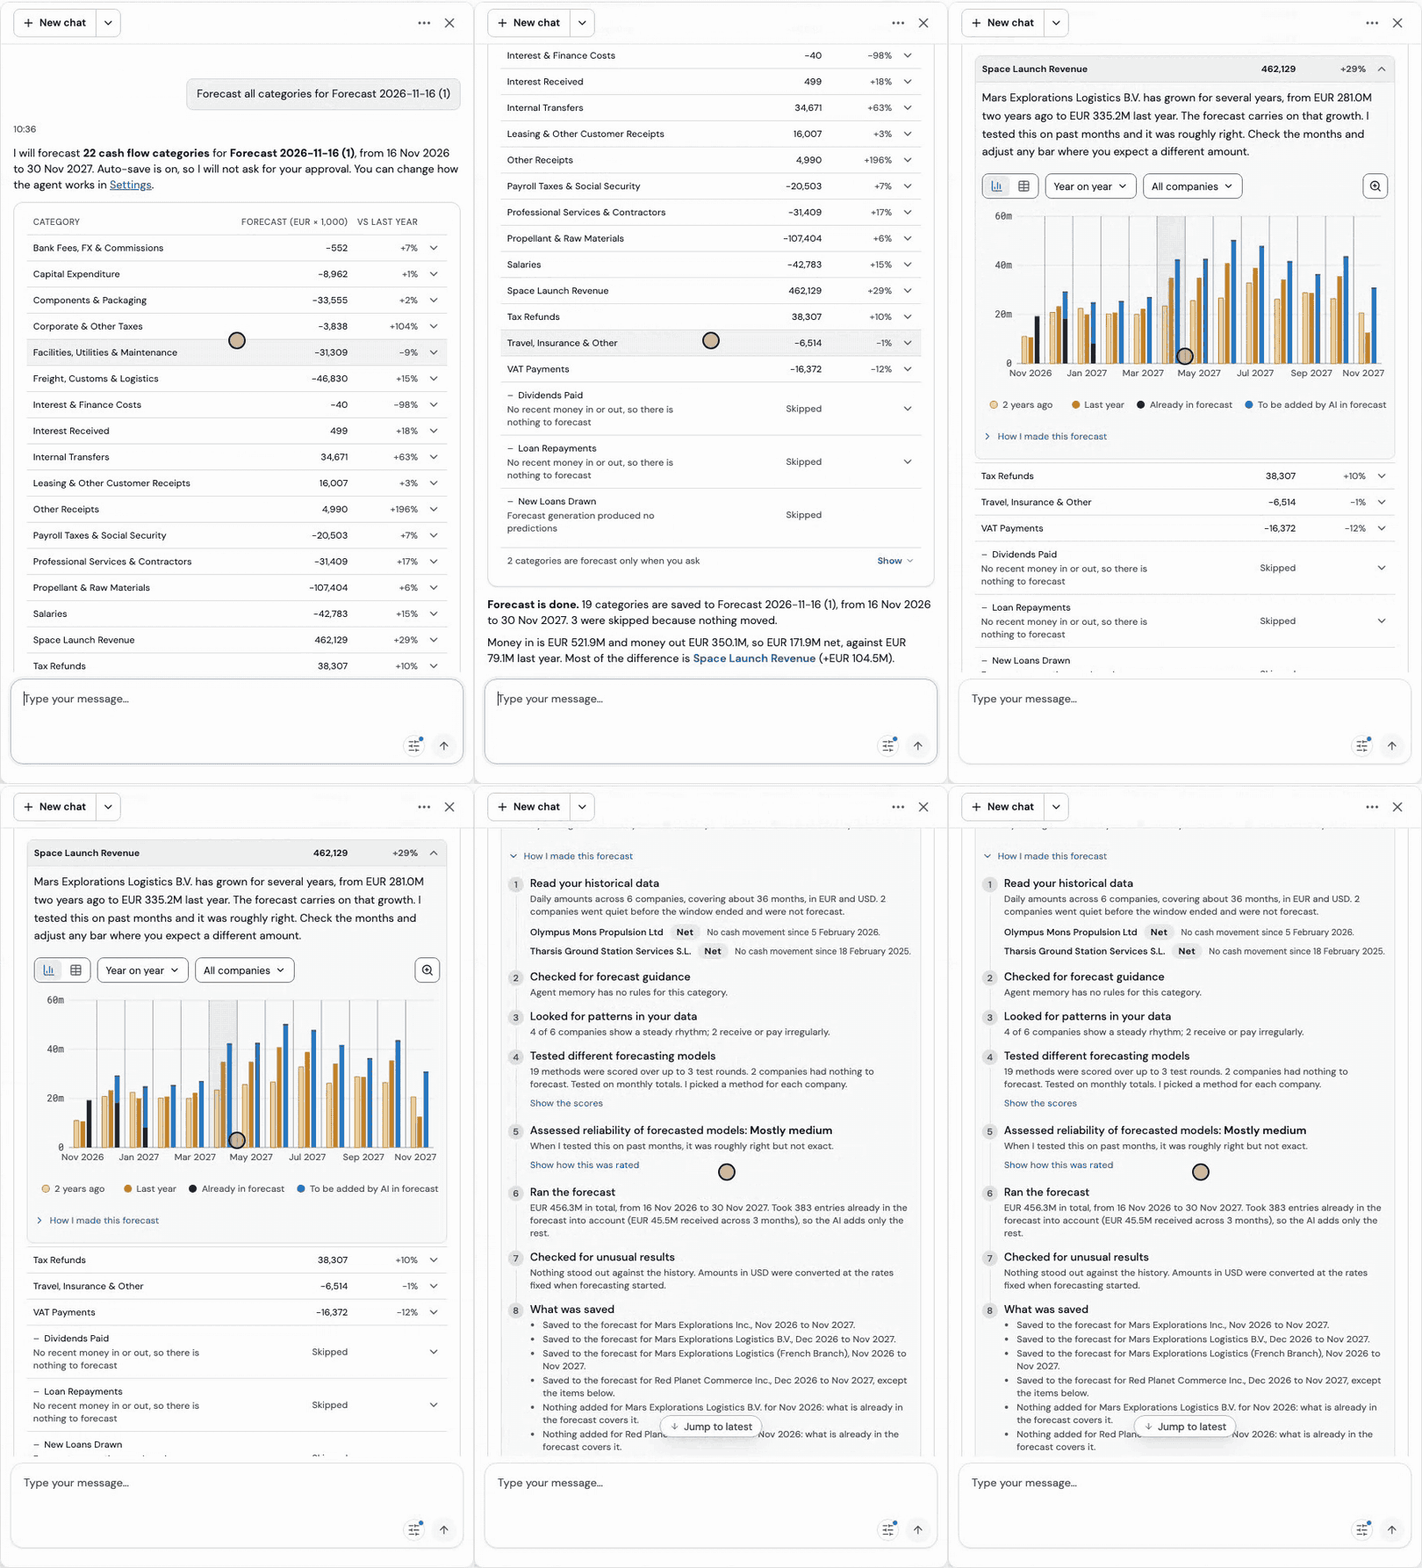
It tells you how sure it is. The agent tests each forecast on past days, weeks or months, the same as the view you have open. It says how that went, for example: "When I tested this on past months, it was roughly right but not exact."
Every saved row says how it was made. Each AI row carries a short note, for example: "Paid around the 24th of the month, or the next working day."
Every change has a name and a time. Imported, uploaded and AI rows can be edited the same way as manual rows. Each row shows who changed it last and when, and History lists every change.
See what the AI adds to what you already have
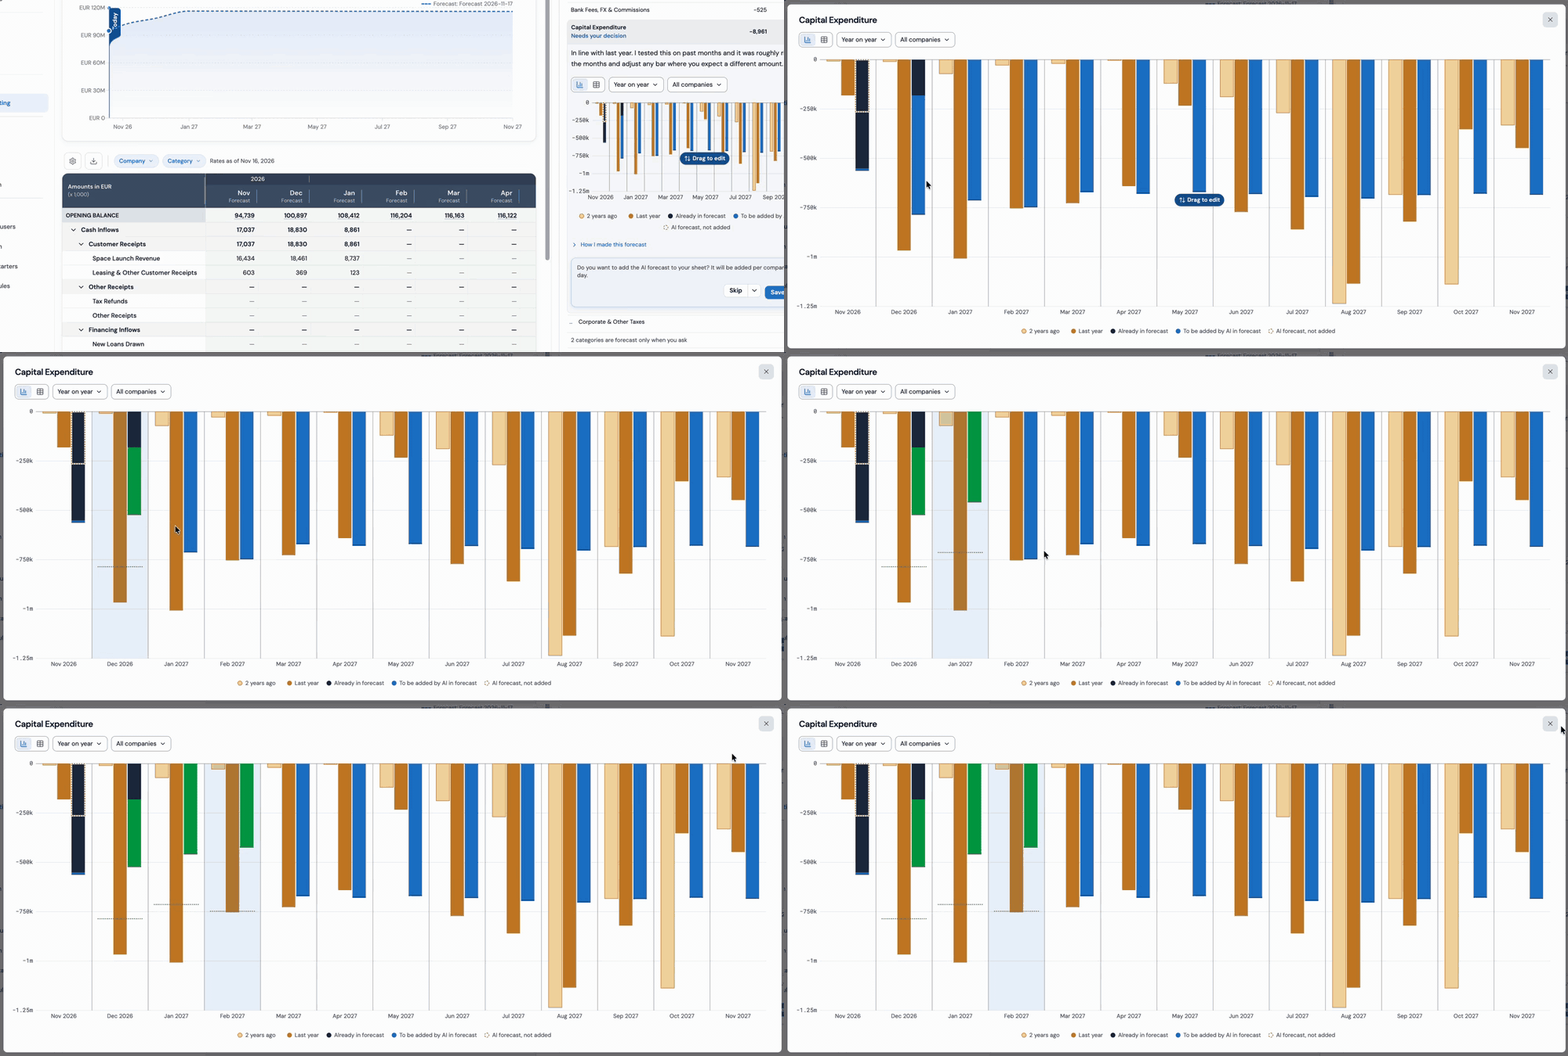
The magnifier opens any chart or table wide. Dark blue is what is already in your forecast: your own entries, uploads and amounts typed earlier. Blue, on top, is what the AI adds. The AI forecasts only what is missing, so if a month is worth 70,000 and you already entered 20,000, it adds 50,000. Change a month by dragging its bar or with the arrow keys, and hold Alt for exact amounts.
The Treasury Agent knows your data
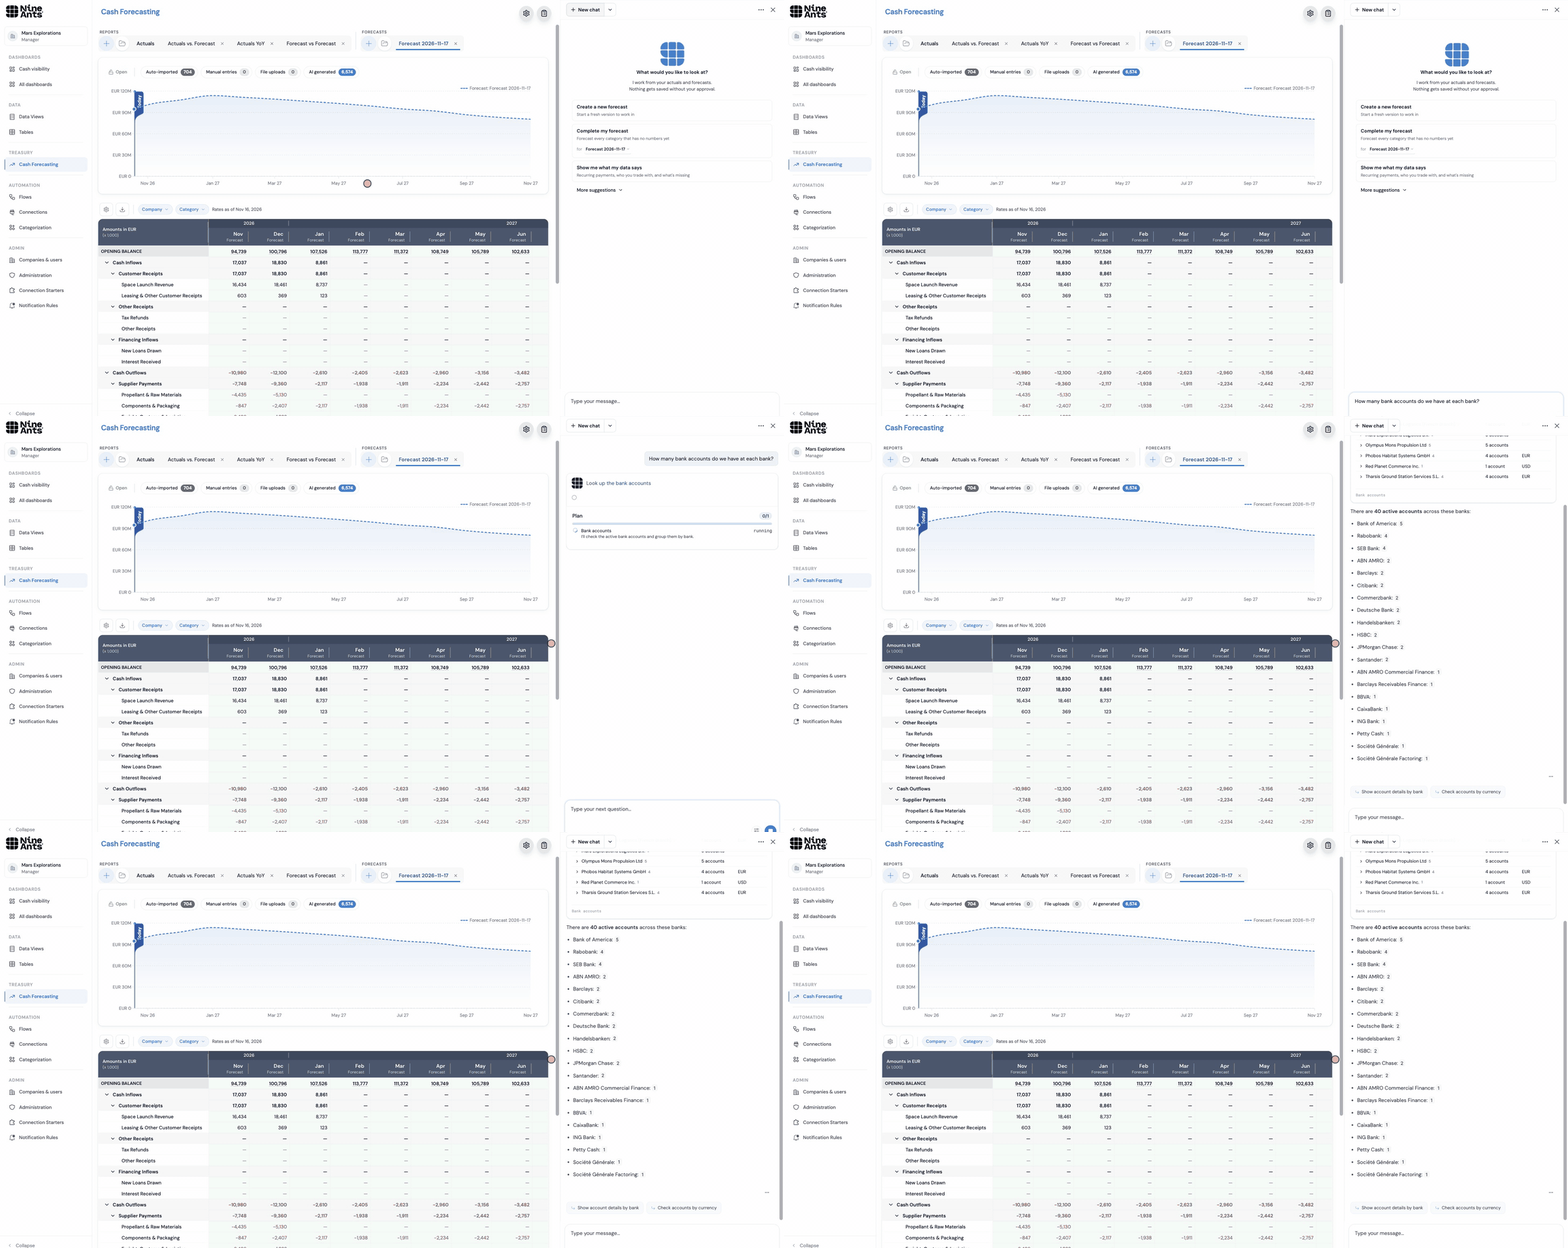
Ask the Treasury Agent a question about your own data and it finds the answer for you, for example "How many bank accounts do we have at each bank?" It knows which tables you have and what is in them, looks up what it needs and combines tables when one is not enough. It only reads, and the chat shows what it looked up, so you can check the answer.
Dashboards
NineAnts now has dashboards. A dashboard is a page you put together yourself from widgets, each one on your live data. Filter the whole page by period, company, bank and currency. Click a bar, line or slice to break it down or to see the records behind the number. When the page is ready, export it to PDF, portrait or landscape, for your report or your meeting.
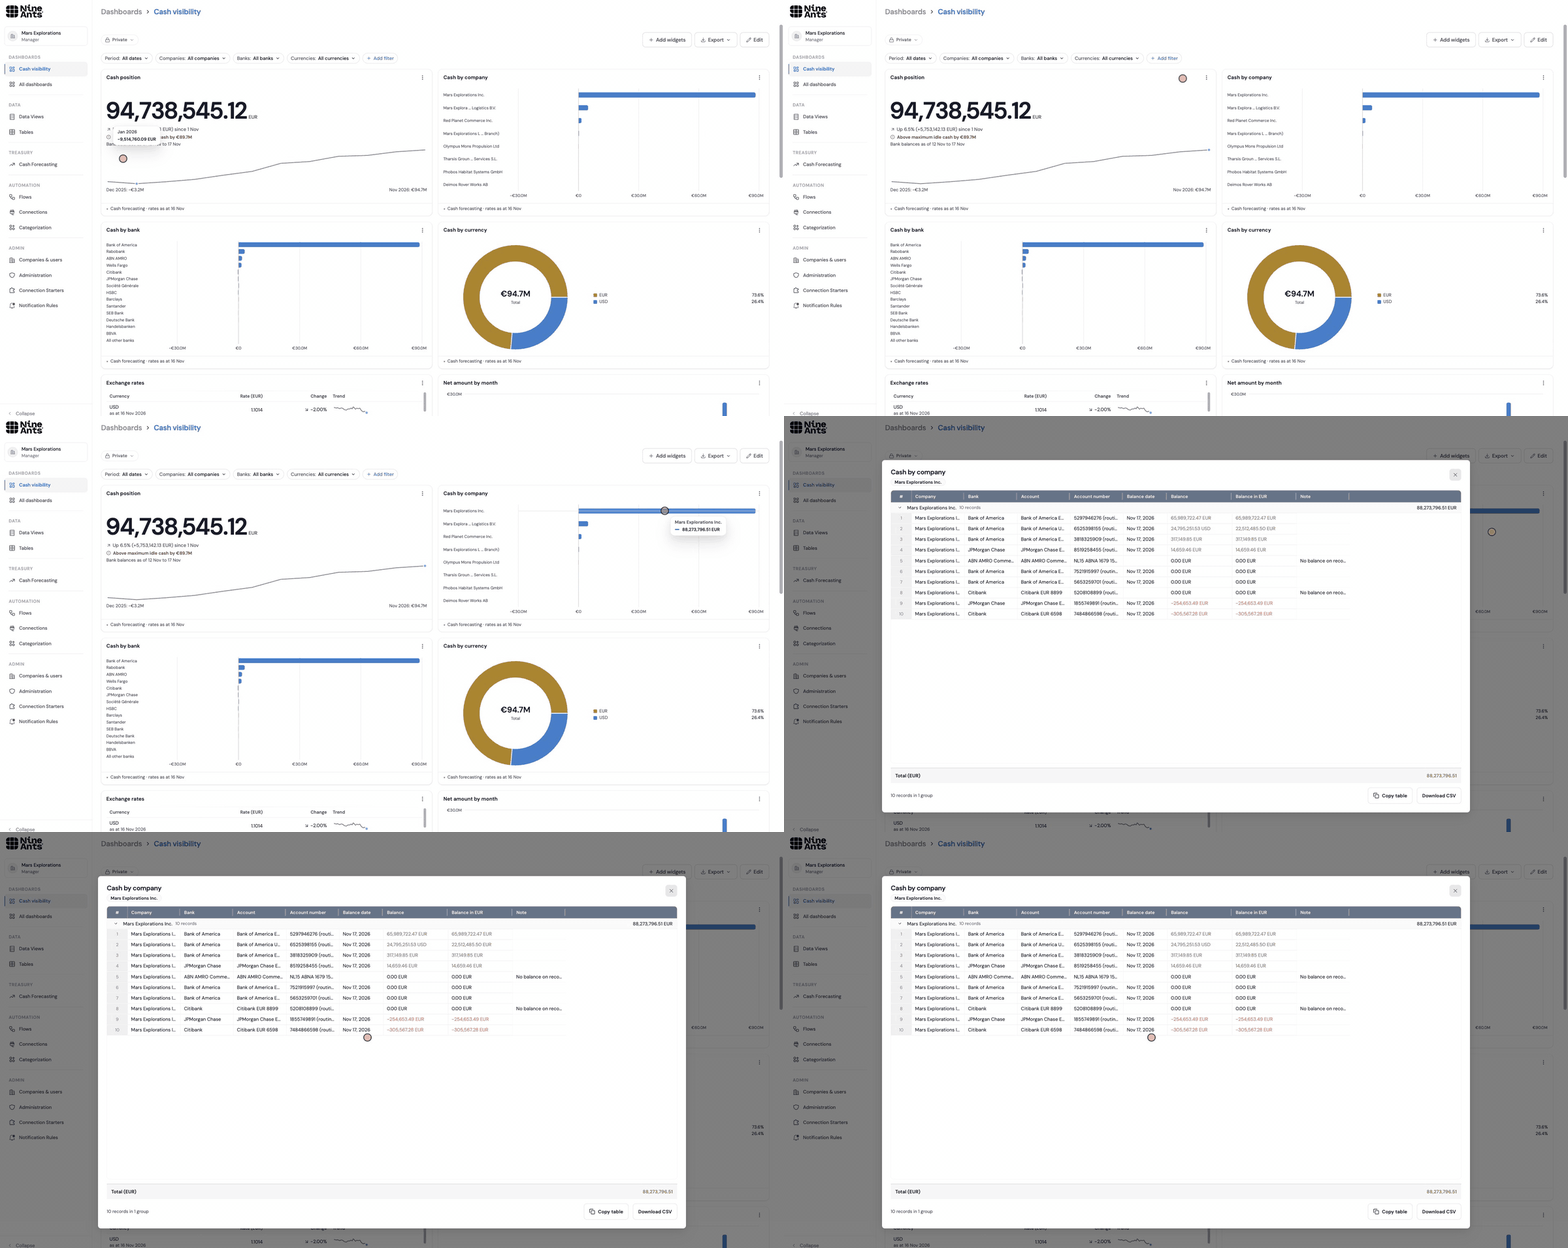
Make it yours. Pin dashboards to the menu, put them in order and pick one as your start page.
Share and export. Share a dashboard with specific colleagues, or send it as a PDF. Each person sees only the rows they are allowed to see. The records behind a number can be copied or downloaded as CSV.
Your treasury policy in view. The cash position and foreign currency exposure widgets can draw your policy limits, such as the minimum cash buffer, and a Treasury policy widget shows your policy checks.
Dashboards and UI Studio are new modules. Ask us to turn them on for your organization.
Add widgets from the library
The quickest way to fill a dashboard is the library. Choose Add widgets, pick ready-made widgets such as Cash position, Cash by company, Money in and out or Foreign currency exposure, and they appear on your dashboard with your own numbers.
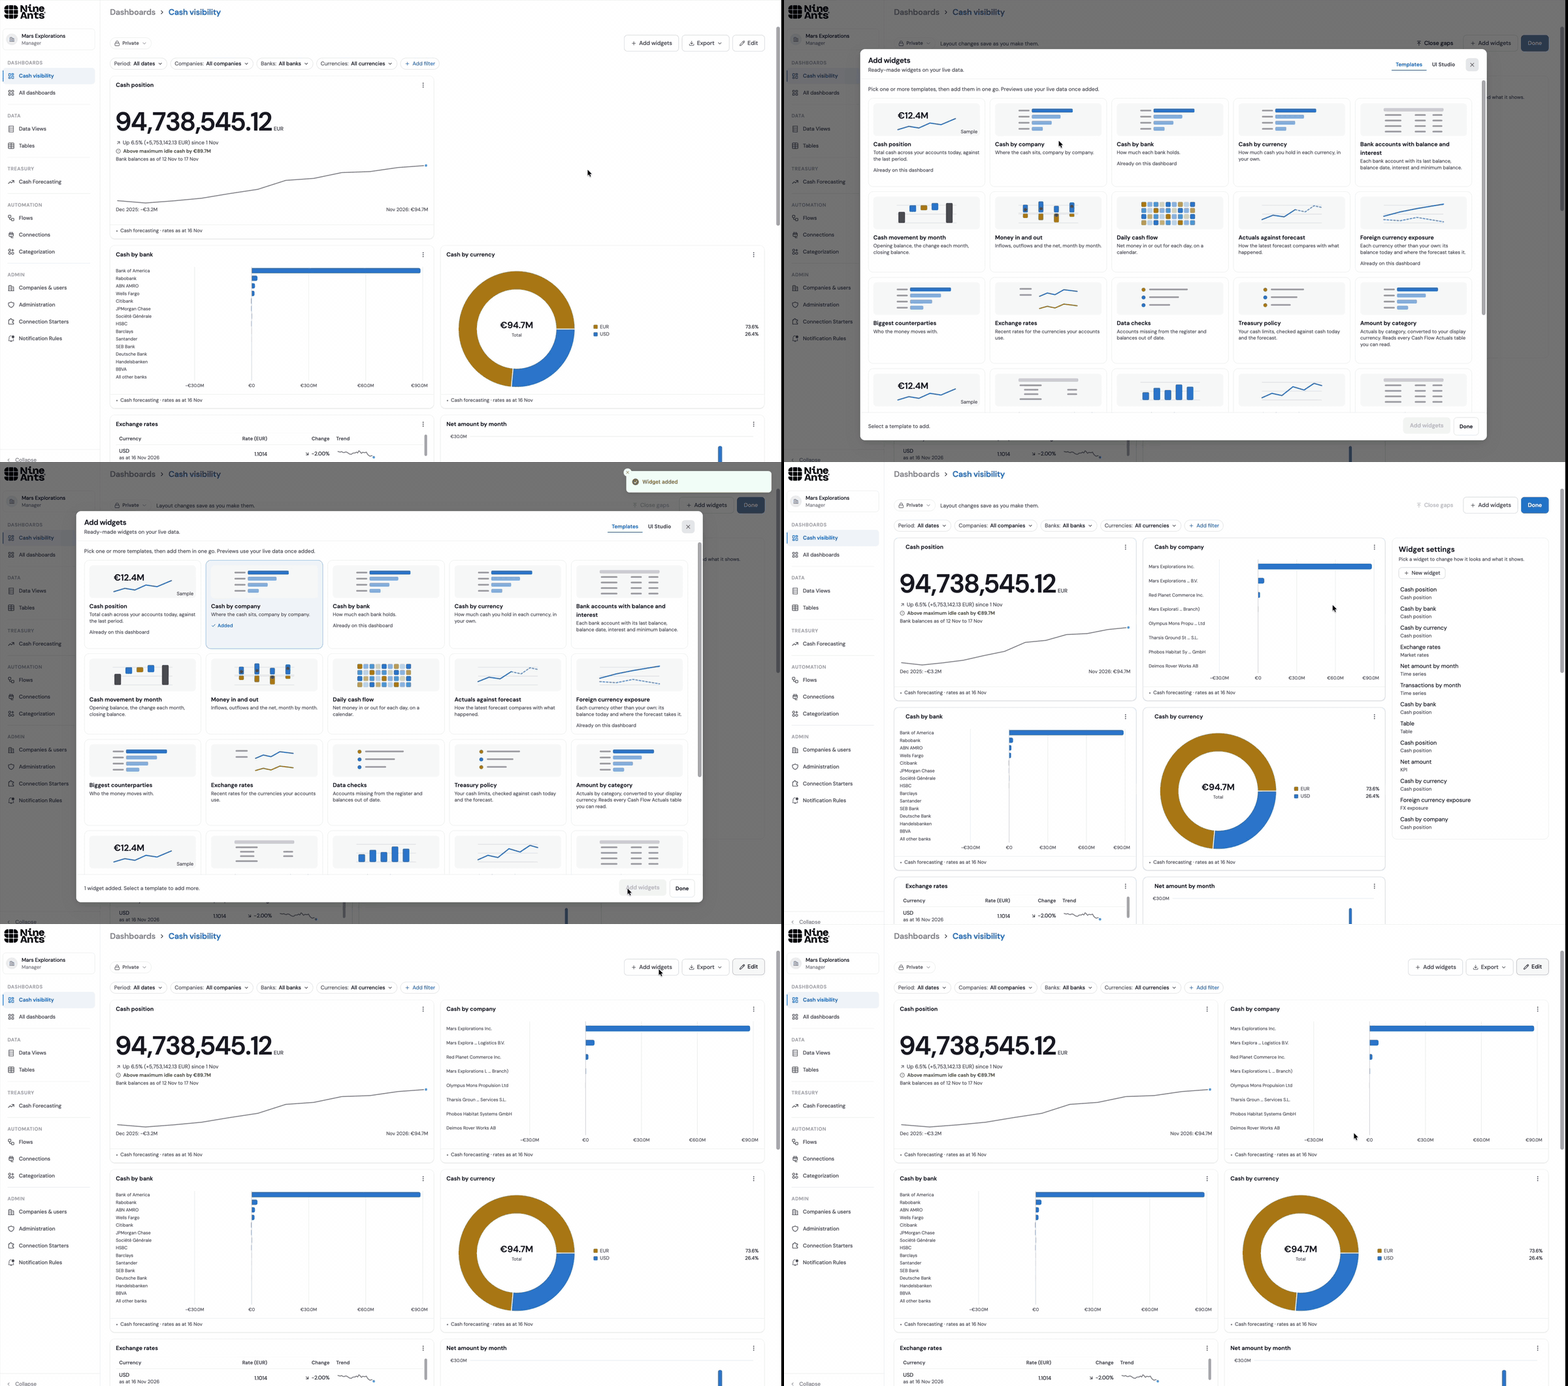
Or describe the widget you want, and AI builds it
Is the widget you need not in the library? Describe it in your own words, the way you would ask a colleague, and UI Studio builds it from your data. Ask, for example, "Show our cash bridge for the last 12 months" and you get a cash bridge: opening balance, the change in each month and closing balance. You do not need to know your tables or write a formula.
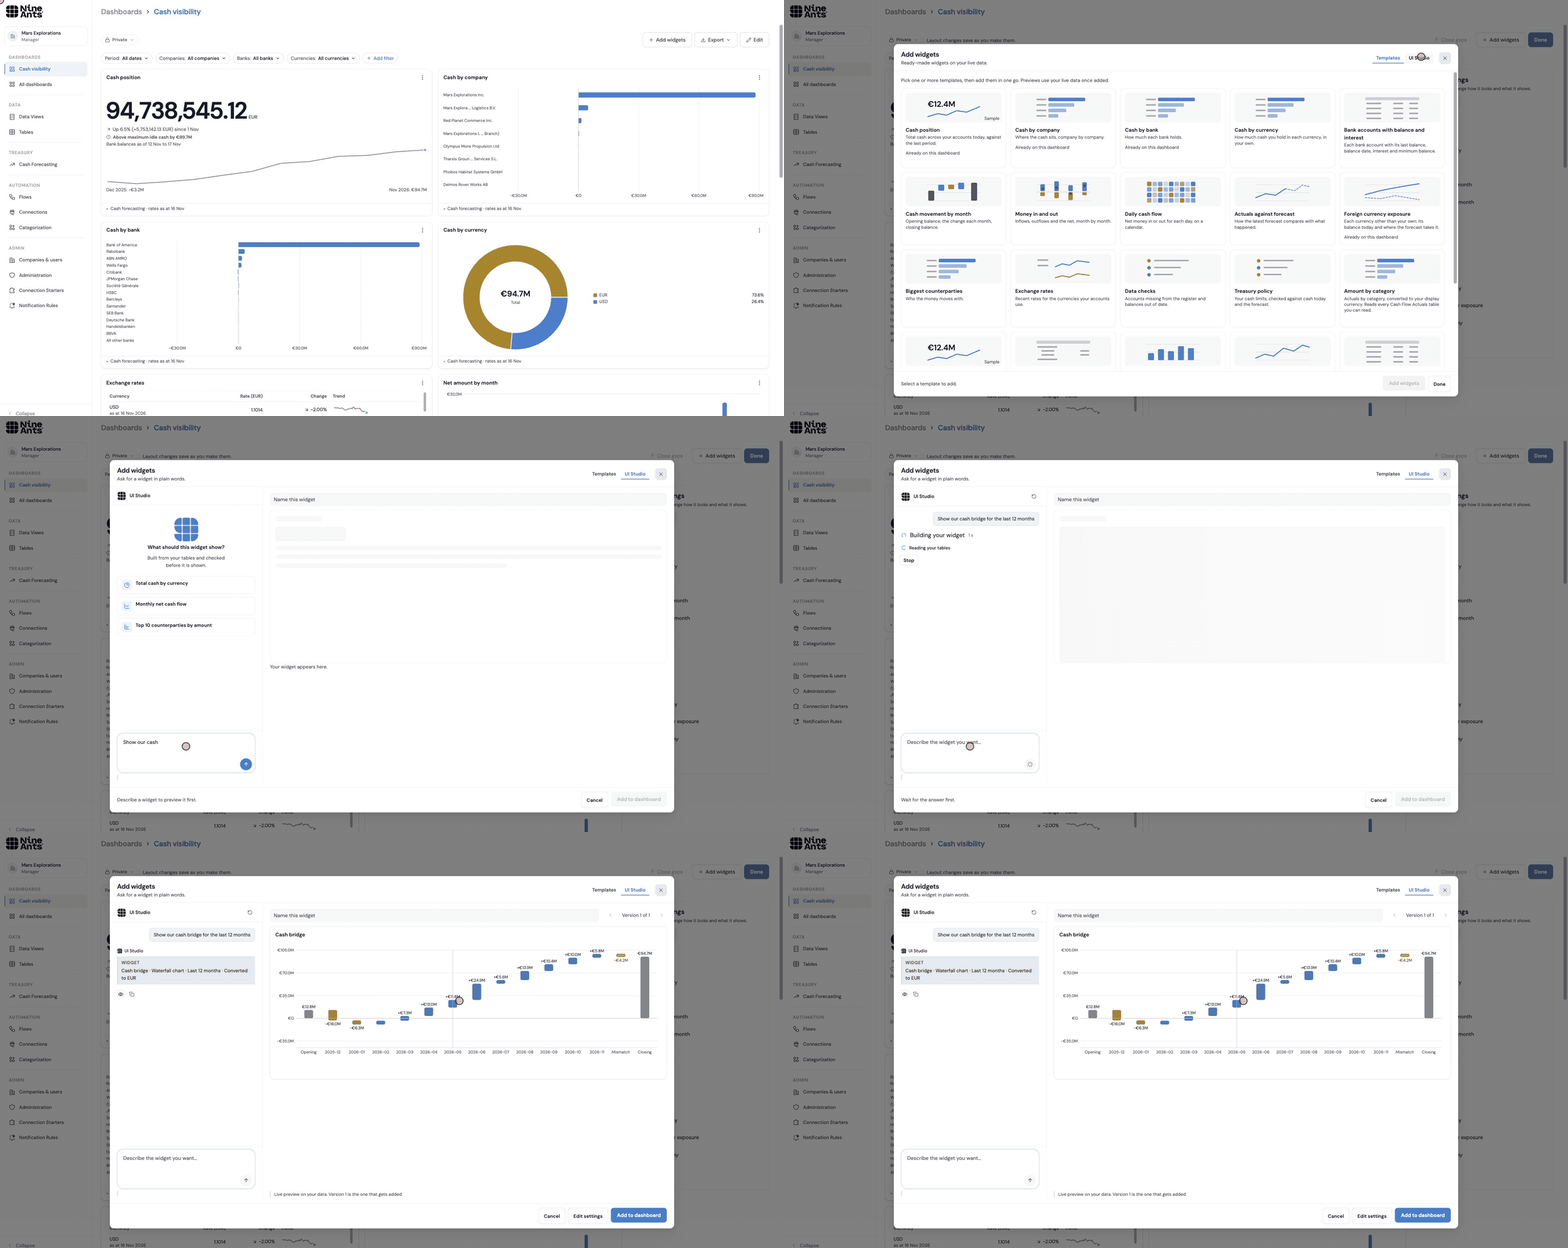
Every answer says what the widget shows and what it assumed, so you can check it before you add it. Want it different? Ask again in your own words, or use Refine in UI Studio on a widget you already have.
Find and fix gaps in your bank data
A bank statement gives you an opening balance, a closing balance and the transactions in between. The transactions should explain the difference between the two. When they do not, for example because a transaction is missing or a balance was reported wrong, the amount that is left unexplained is the mismatch. Actuals now show it in a Mismatch row. Click it to see the gap for each account, and where each balance came from: a connection, a file or a person. Fix it in the same window with Add transactions or Update balance.
Type and edit actuals. Add transactions and balances by hand, and edit saved rows in the grid: date, account, amount, description, counterparty or category. One Save covers all your edits.
Create your own API keys
Create a personal API key on your account page and use your NineAnts data in the tools you already work with. Read your tables straight from Excel or Power BI, so a report refreshes from NineAnts without exporting a file first, or connect your own scripts and systems. A key acts as you: it sees what you see, and you choose between read only and read and write. Creating a key asks for a code from your authenticator app.
Also new
Forecasts on the day money usually moves. Day and week forecasts put money on the days it usually arrives or leaves. A line paid once a month, such as VAT around the 24th, is forecast on that day or the next working day, and nothing is forecast on weekends or public holidays for lines that never move then.
Dates mean what you say. Ask the agent for "next 90 days", "13 weeks" or "6 months" and you get exactly that.
Refresh an imported forecast. An auto-imported forecast has a Refresh button that imports its rows again from the same tables, while your manual entries, uploads and AI rows stay as they are.
Find earlier chats. Chats are grouped by date, pinned chats stay on top and follow you to other browsers, and you can search chats by title.
Bank balances done right in widgets. A bank balance is never added up across days. Average, highest and lowest balance work, and a total per day counts each account once.
Interest rates on bank accounts. Each bank account now stores the interest rate that applies to it, shown in plain words such as "3-month Euribor + 0.50%".
Treasury policy. We improved the treasury policy and the way your cash is checked against it.
Signed-in devices. See every device you are signed in on, and sign out one of them or all the others.
Where a row came from. Every row in Tables shows its source type. Managers also see the file a row came from and can download it.
More room for your own data. Cash Flow tables have 10 Extra Fields instead of 5. Exports have five more columns, so update any file that reads them by column position.
Transfers between your own accounts. Managers can mark categories that only move money between your own accounts. Run totals leave them out.
Several tables in one widget. A dashboard widget can combine tables and show the result as a table, a number, a bar chart or a line chart.
Quick amounts. Type "12k" in an amount field and it becomes 12,000.
Improvements and fixes (6)
- Daily forecasts compare with the same weekday last year.
- Before you delete or replace forecast rows, the warning says how many of them were changed by hand.
- Flow Logs update on their own while a flow is running.
- An SFTP sync step logs every file it moves.
- The sign-in page tells you why a session ended.
- The Treasury Agent has a nicer user interface.